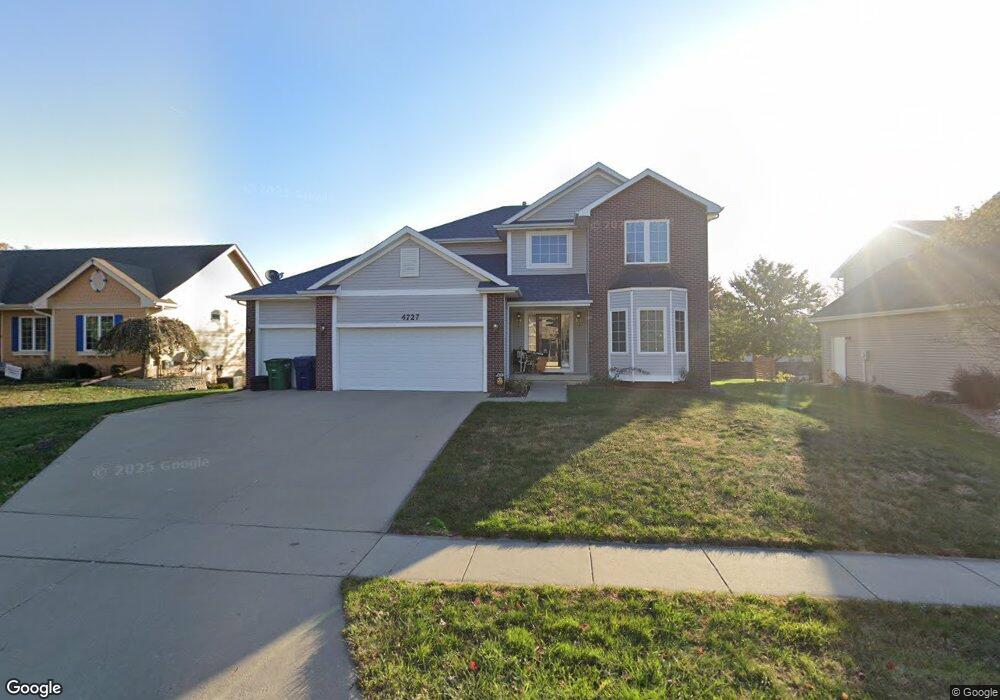
4727 76th St Urbandale, IA 50322
Estimated Value: $409,000 - $450,000
4
Beds
3
Baths
2,102
Sq Ft
$204/Sq Ft
Est. Value
About This Home
This home is located at 4727 76th St, Urbandale, IA 50322 and is currently estimated at $429,578, approximately $204 per square foot. 4727 76th St is a home located in Polk County with nearby schools including Timber Ridge Elementary School, Summit Middle School, and Johnston Middle School.
Ownership History
Date
Name
Owned For
Owner Type
Purchase Details
Closed on
Feb 14, 2002
Sold by
Jerrys Homes Inc
Bought by
Ung Hung and Phrommany Ung Sou
Current Estimated Value
Home Financials for this Owner
Home Financials are based on the most recent Mortgage that was taken out on this home.
Original Mortgage
$199,000
Interest Rate
6.69%
Purchase Details
Closed on
Oct 15, 2001
Sold by
Jv Auv
Bought by
Jerrys Homes Inc
Create a Home Valuation Report for This Property
The Home Valuation Report is an in-depth analysis detailing your home's value as well as a comparison with similar homes in the area
Home Values in the Area
Average Home Value in this Area
Purchase History
| Date | Buyer | Sale Price | Title Company |
|---|---|---|---|
| Ung Hung | $248,500 | -- | |
| Jerrys Homes Inc | $44,500 | -- |
Source: Public Records
Mortgage History
| Date | Status | Borrower | Loan Amount |
|---|---|---|---|
| Closed | Ung Hung | $199,000 |
Source: Public Records
Tax History Compared to Growth
Tax History
| Year | Tax Paid | Tax Assessment Tax Assessment Total Assessment is a certain percentage of the fair market value that is determined by local assessors to be the total taxable value of land and additions on the property. | Land | Improvement |
|---|---|---|---|---|
| 2025 | $6,738 | $447,300 | $59,900 | $387,400 |
| 2024 | $6,738 | $425,500 | $55,600 | $369,900 |
| 2023 | $6,254 | $425,500 | $55,600 | $369,900 |
| 2022 | $7,036 | $342,800 | $46,700 | $296,100 |
| 2021 | $6,878 | $342,800 | $46,700 | $296,100 |
| 2020 | $6,764 | $318,200 | $43,200 | $275,000 |
| 2019 | $6,592 | $318,200 | $43,200 | $275,000 |
| 2018 | $6,346 | $292,600 | $38,800 | $253,800 |
| 2017 | $5,920 | $292,600 | $38,800 | $253,800 |
| 2016 | $5,776 | $267,400 | $34,900 | $232,500 |
| 2015 | $5,776 | $267,400 | $34,900 | $232,500 |
| 2014 | $5,044 | $247,600 | $31,800 | $215,800 |
Source: Public Records
Map
Nearby Homes