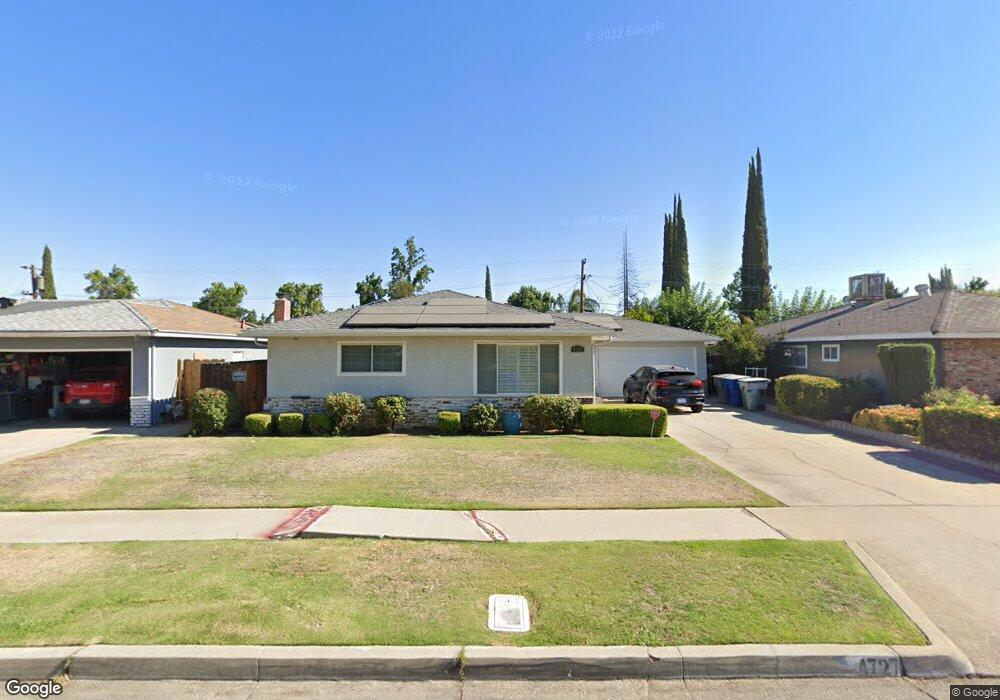
4727 E Ashcroft Ave Fresno, CA 93726
Hoover NeighborhoodEstimated Value: $372,000 - $393,000
3
Beds
2
Baths
1,500
Sq Ft
$253/Sq Ft
Est. Value
About This Home
This home is located at 4727 E Ashcroft Ave, Fresno, CA 93726 and is currently estimated at $380,018, approximately $253 per square foot. 4727 E Ashcroft Ave is a home located in Fresno County with nearby schools including Vinland Elementary School, Tioga Middle School, and Herbert Hoover High School.
Ownership History
Date
Name
Owned For
Owner Type
Purchase Details
Closed on
May 6, 2021
Sold by
Kendrick Brent
Bought by
Mcgensy Jason and Mcgensy Amina
Current Estimated Value
Home Financials for this Owner
Home Financials are based on the most recent Mortgage that was taken out on this home.
Original Mortgage
$311,258
Outstanding Balance
$279,195
Interest Rate
3%
Mortgage Type
FHA
Estimated Equity
$100,823
Purchase Details
Closed on
Jan 2, 2015
Sold by
Kendrick Rubigo
Bought by
Kendrick Brent
Home Financials for this Owner
Home Financials are based on the most recent Mortgage that was taken out on this home.
Original Mortgage
$170,210
Interest Rate
3.8%
Mortgage Type
New Conventional
Create a Home Valuation Report for This Property
The Home Valuation Report is an in-depth analysis detailing your home's value as well as a comparison with similar homes in the area
Home Values in the Area
Average Home Value in this Area
Purchase History
| Date | Buyer | Sale Price | Title Company |
|---|---|---|---|
| Mcgensy Jason | $317,000 | Fidelity National Title Co | |
| Kendrick Brent | -- | Fidelity National Title Co | |
| Kendrick Brent | $183,500 | Fidelity National Title Co |
Source: Public Records
Mortgage History
| Date | Status | Borrower | Loan Amount |
|---|---|---|---|
| Open | Mcgensy Jason | $311,258 | |
| Previous Owner | Kendrick Brent | $170,210 | |
| Previous Owner | Kendrick Brent | $11,606 |
Source: Public Records
Tax History
| Year | Tax Paid | Tax Assessment Tax Assessment Total Assessment is a certain percentage of the fair market value that is determined by local assessors to be the total taxable value of land and additions on the property. | Land | Improvement |
|---|---|---|---|---|
| 2025 | $4,459 | $343,128 | $64,945 | $278,183 |
| 2023 | $4,207 | $329,806 | $62,424 | $267,382 |
| 2022 | $4,150 | $323,340 | $61,200 | $262,140 |
| 2021 | $2,604 | $203,738 | $49,961 | $153,777 |
| 2020 | $2,593 | $201,650 | $49,449 | $152,201 |
| 2019 | $2,494 | $197,697 | $48,480 | $149,217 |
| 2018 | $2,440 | $193,822 | $47,530 | $146,292 |
| 2017 | $2,398 | $190,023 | $46,599 | $143,424 |
| 2016 | $2,319 | $186,298 | $45,686 | $140,612 |
| 2015 | $1,426 | $113,693 | $32,479 | $81,214 |
| 2014 | $1,314 | $111,467 | $31,843 | $79,624 |
Source: Public Records
Map
Nearby Homes
- 4737 E Norwich Ave
- 4497 N Chestnut Ave
- 4706 E San Gabriel Ave
- 4747 N Woodrow Ave Unit 120
- 4747 N Woodrow Ave Unit 140
- 4545 N Meridian Ave
- 4757 N Woodrow Ave Unit 141
- 4676 E Alamos Ave Unit 106
- 4718 E Alamos Ave Unit 101
- 4727 E Alamos Ave Unit 106
- 2931 Paula Dr
- 4891 E Rialto Ave
- 4875 N Backer Ave Unit 141
- 4875 N Backer Ave Unit 143
- 916 W Holland Ave
- 4843 N Winery Cir Unit 101
- 4815 N Winery Cir
- 4885 N Backer Ave Unit 156
- 4885 N Backer Ave Unit 151
- 4885 N Backer Ave Unit 154
- 4723 E Ashcroft Ave
- 4731 E Ashcroft Ave
- 4726 E Indianapolis Ave
- 4735 E Ashcroft Ave
- 4719 E Ashcroft Ave
- 4722 E Indianapolis Ave
- 4734 E Indianapolis Ave
- 4728 E Ashcroft Ave
- 4724 E Ashcroft Ave
- 4732 E Ashcroft Ave
- 4716 E Indianapolis Ave
- 4741 E Ashcroft Ave
- 4711 E Ashcroft Ave
- 4740 E Indianapolis Ave
- 4720 E Ashcroft Ave
- 4738 E Ashcroft Ave
- 4742 E Ashcroft Ave
- 4714 E Ashcroft Ave
- 4744 E Indianapolis Ave
- 4729 E Holland Ave
Your Personal Tour Guide
Ask me questions while you tour the home.