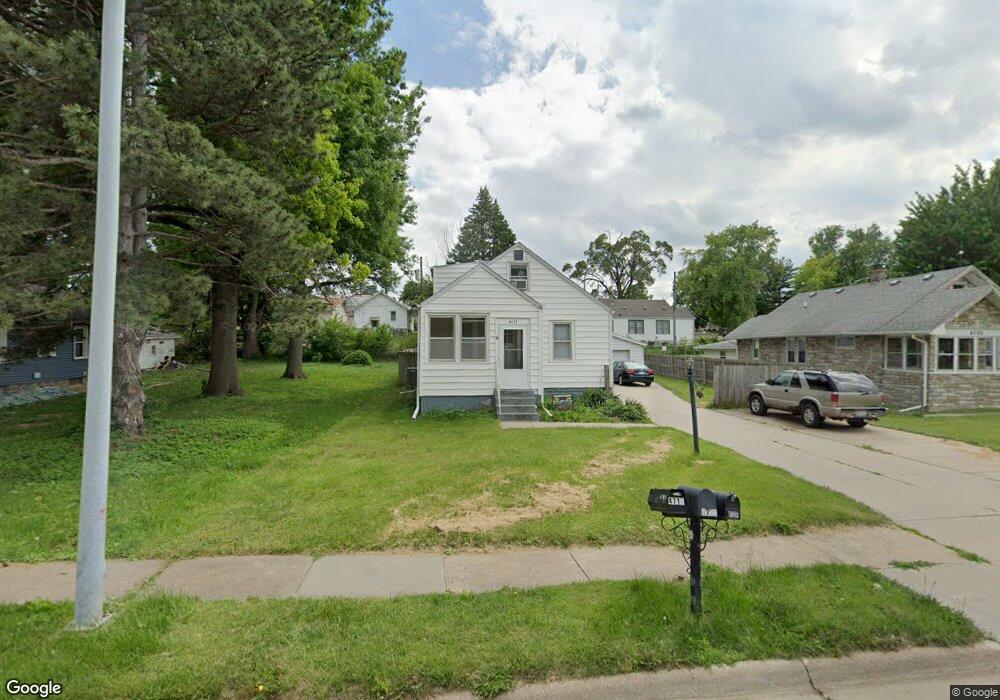
4727 P St Omaha, NE 68117
South Central Omaha NeighborhoodEstimated Value: $166,000 - $227,000
3
Beds
2
Baths
1,306
Sq Ft
$153/Sq Ft
Est. Value
About This Home
This home is located at 4727 P St, Omaha, NE 68117 and is currently estimated at $199,333, approximately $152 per square foot. 4727 P St is a home located in Douglas County with nearby schools including Ashland Park-Robbins Elementary School, Sts. Peter and Paul School, and St Thomas More School.
Ownership History
Date
Name
Owned For
Owner Type
Purchase Details
Closed on
Dec 21, 2018
Sold by
Riskowski Joseph Stanley and Riskowski Robin
Bought by
Riskowski Anthony W and Riskowski Amanda
Current Estimated Value
Home Financials for this Owner
Home Financials are based on the most recent Mortgage that was taken out on this home.
Original Mortgage
$52,250
Outstanding Balance
$46,125
Interest Rate
4.9%
Mortgage Type
New Conventional
Estimated Equity
$153,208
Purchase Details
Closed on
Sep 27, 2011
Sold by
Federal National Mortgage Association
Bought by
Riskowski Joseph Stanley
Purchase Details
Closed on
Jan 11, 2011
Sold by
Rockwell Myosha S and Rockwell Richard O
Bought by
Fannie Mae
Purchase Details
Closed on
May 31, 2007
Sold by
Pryjmak Scott
Bought by
Rockwell Richard O
Create a Home Valuation Report for This Property
The Home Valuation Report is an in-depth analysis detailing your home's value as well as a comparison with similar homes in the area
Home Values in the Area
Average Home Value in this Area
Purchase History
| Date | Buyer | Sale Price | Title Company |
|---|---|---|---|
| Riskowski Anthony W | $543,889 | None Available | |
| Riskowski Joseph Stanley | -- | Dodge Title & Escrow Co Llc | |
| Fannie Mae | $109,553 | None Available | |
| Rockwell Richard O | $115,000 | -- |
Source: Public Records
Mortgage History
| Date | Status | Borrower | Loan Amount |
|---|---|---|---|
| Open | Riskowski Anthony W | $52,250 |
Source: Public Records
Tax History Compared to Growth
Tax History
| Year | Tax Paid | Tax Assessment Tax Assessment Total Assessment is a certain percentage of the fair market value that is determined by local assessors to be the total taxable value of land and additions on the property. | Land | Improvement |
|---|---|---|---|---|
| 2024 | $2,939 | $139,300 | $13,600 | $125,700 |
| 2023 | $2,939 | $139,300 | $13,600 | $125,700 |
| 2022 | $2,461 | $115,300 | $10,000 | $105,300 |
| 2021 | $2,241 | $105,900 | $10,000 | $95,900 |
| 2020 | $2,117 | $98,900 | $10,000 | $88,900 |
| 2019 | $2,124 | $98,900 | $10,000 | $88,900 |
| 2018 | $1,875 | $87,200 | $10,000 | $77,200 |
| 2017 | $1,513 | $70,000 | $7,000 | $63,000 |
| 2016 | $1,502 | $70,000 | $7,000 | $63,000 |
| 2015 | $1,482 | $70,000 | $7,000 | $63,000 |
| 2014 | $1,482 | $70,000 | $7,000 | $63,000 |
Source: Public Records
Map
Nearby Homes