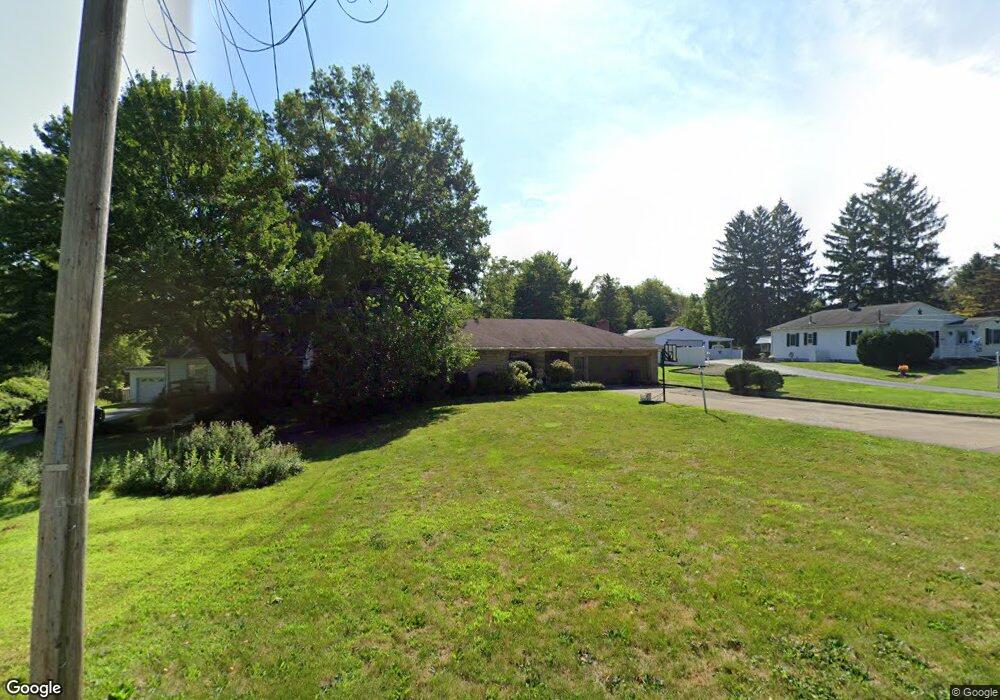
4729 Simon Rd Youngstown, OH 44512
Estimated Value: $161,000 - $201,000
3
Beds
3
Baths
1,702
Sq Ft
$109/Sq Ft
Est. Value
About This Home
This home is located at 4729 Simon Rd, Youngstown, OH 44512 and is currently estimated at $186,141, approximately $109 per square foot. 4729 Simon Rd is a home located in Mahoning County with nearby schools including Robinwood Lane Elementary School, Boardman Glenwood Junior High School, and Boardman High School.
Ownership History
Date
Name
Owned For
Owner Type
Purchase Details
Closed on
Aug 13, 2009
Sold by
Mosconi Sharon A
Bought by
Johnson Dennis L and Johnson Helen A
Current Estimated Value
Home Financials for this Owner
Home Financials are based on the most recent Mortgage that was taken out on this home.
Original Mortgage
$76,000
Outstanding Balance
$48,737
Interest Rate
5.21%
Mortgage Type
New Conventional
Estimated Equity
$137,405
Purchase Details
Closed on
May 21, 2002
Sold by
Mosconi Dominic V
Bought by
Mosconi Sharon A
Purchase Details
Closed on
Dec 3, 1997
Sold by
Larocca Dominic and Larocca Angela
Bought by
Mosconi Dominic and Mosconi Sharon A
Home Financials for this Owner
Home Financials are based on the most recent Mortgage that was taken out on this home.
Original Mortgage
$85,000
Interest Rate
7.46%
Purchase Details
Closed on
Aug 27, 1973
Bought by
Larocca Dominic and Larocca Angela
Create a Home Valuation Report for This Property
The Home Valuation Report is an in-depth analysis detailing your home's value as well as a comparison with similar homes in the area
Home Values in the Area
Average Home Value in this Area
Purchase History
| Date | Buyer | Sale Price | Title Company |
|---|---|---|---|
| Johnson Dennis L | $95,000 | Attorney | |
| Mosconi Sharon A | -- | -- | |
| Mosconi Dominic | $115,000 | -- | |
| Larocca Dominic | -- | -- |
Source: Public Records
Mortgage History
| Date | Status | Borrower | Loan Amount |
|---|---|---|---|
| Open | Johnson Dennis L | $76,000 | |
| Previous Owner | Mosconi Dominic | $85,000 |
Source: Public Records
Tax History
| Year | Tax Paid | Tax Assessment Tax Assessment Total Assessment is a certain percentage of the fair market value that is determined by local assessors to be the total taxable value of land and additions on the property. | Land | Improvement |
|---|---|---|---|---|
| 2025 | $2,884 | $57,860 | $5,640 | $52,220 |
| 2024 | $2,992 | $57,860 | $5,640 | $52,220 |
| 2023 | $2,952 | $57,860 | $5,640 | $52,220 |
| 2022 | $2,728 | $40,800 | $5,480 | $35,320 |
| 2021 | $2,730 | $40,800 | $5,480 | $35,320 |
| 2020 | $2,744 | $40,800 | $5,480 | $35,320 |
| 2019 | $2,572 | $33,180 | $4,460 | $28,720 |
| 2018 | $2,143 | $33,180 | $4,460 | $28,720 |
| 2017 | $2,120 | $33,180 | $4,460 | $28,720 |
| 2016 | $2,009 | $31,110 | $4,980 | $26,130 |
| 2015 | $1,969 | $31,110 | $4,980 | $26,130 |
| 2014 | $1,975 | $31,110 | $4,980 | $26,130 |
| 2013 | $1,950 | $31,110 | $4,980 | $26,130 |
Source: Public Records
Map
Nearby Homes
- 4629 Yarmouth Ln
- 0 Cranberry Ln Unit 5170595
- 4212 South Ave
- 850 Afton Ave
- 0 Indianola Rd
- 1514 Thalia Ave
- 368 Erskine Ave
- 895 Cook Ave
- 1513 Wakefield Ave
- 4038 Sunset Blvd
- 4206 Rush Blvd
- 1553 Bancroft Ave
- 0 Lemoyne Ave
- 1750 Halbert Dr
- 189 Beechwood Dr
- 1737 Halbert Dr
- 1579 Wakefield Ave
- 190 Melrose Ave
- 1549 Medford Ave
- 196 Maywood Dr
Your Personal Tour Guide
Ask me questions while you tour the home.