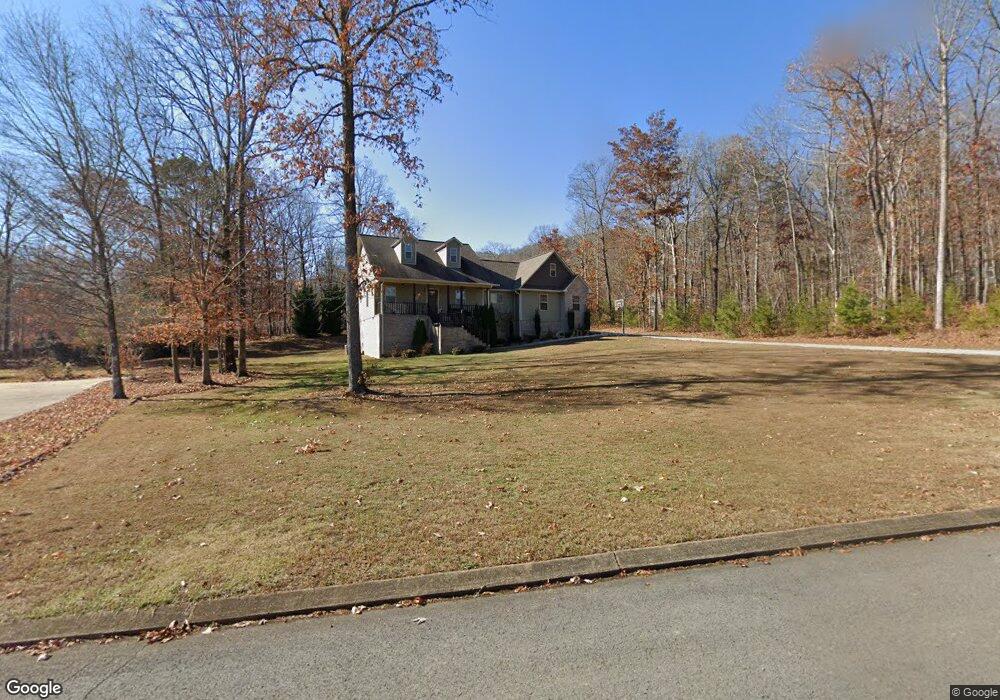
473 Big Cedar Dr Dunlap, TN 37327
Estimated Value: $421,263 - $520,000
Studio
1
Bath
2,521
Sq Ft
$190/Sq Ft
Est. Value
About This Home
This home is located at 473 Big Cedar Dr, Dunlap, TN 37327 and is currently estimated at $478,566, approximately $189 per square foot. 473 Big Cedar Dr is a home with nearby schools including Griffith Elementary School, Sequatchie County Middle School, and Sequatchie County High School.
Ownership History
Date
Name
Owned For
Owner Type
Purchase Details
Closed on
Jul 10, 2015
Sold by
Benton Donald R
Bought by
Hobbs James Bryn and Hobbs Marcie Jean
Current Estimated Value
Purchase Details
Closed on
Jul 12, 2009
Sold by
Atlantic Property Investme
Bought by
Benton Donald R
Purchase Details
Closed on
Oct 12, 2008
Bought by
Atlantic Properties Investments Llc
Purchase Details
Closed on
May 10, 2007
Bought by
Atlantic Properties Inc
Purchase Details
Closed on
May 26, 2006
Bought by
The Bluffs Property Inc
Purchase Details
Closed on
Feb 8, 2006
Bought by
Wilson Riley
Purchase Details
Closed on
Jan 16, 2001
Sold by
Mills Dennis L and Mills Kathy
Bought by
Sprouse Larry R
Purchase Details
Closed on
Oct 25, 1994
Bought by
Mills Dennis L Sprouse Larry R
Purchase Details
Closed on
Sep 7, 1990
Bought by
Mills Dennis Sprouse Larry R
Create a Home Valuation Report for This Property
The Home Valuation Report is an in-depth analysis detailing your home's value as well as a comparison with similar homes in the area
Home Values in the Area
Average Home Value in this Area
Purchase History
| Date | Buyer | Sale Price | Title Company |
|---|---|---|---|
| Hobbs James Bryn | $10,000 | -- | |
| Benton Donald R | $7,920 | -- | |
| Atlantic Properties Investments Llc | -- | -- | |
| Atlantic Properties Inc | -- | -- | |
| The Bluffs Property Inc | $1,800,000 | -- | |
| Wilson Riley | $666,000 | -- | |
| Sprouse Larry R | -- | -- | |
| Mills Dennis L Sprouse Larry R | $56,000 | -- | |
| Mills Dennis Sprouse Larry R | $840,000 | -- |
Source: Public Records
Tax History
| Year | Tax Paid | Tax Assessment Tax Assessment Total Assessment is a certain percentage of the fair market value that is determined by local assessors to be the total taxable value of land and additions on the property. | Land | Improvement |
|---|---|---|---|---|
| 2025 | $1,892 | $103,025 | $6,250 | $96,775 |
| 2024 | $1,892 | $103,025 | $6,250 | $96,775 |
| 2023 | $1,892 | $103,025 | $6,250 | $96,775 |
| 2022 | $1,446 | $59,225 | $6,125 | $53,100 |
| 2021 | $1,446 | $59,225 | $6,125 | $53,100 |
| 2020 | $1,446 | $59,225 | $6,125 | $53,100 |
| 2019 | $1,446 | $59,225 | $6,125 | $53,100 |
| 2018 | $1,446 | $59,225 | $6,125 | $53,100 |
| 2017 | $1,026 | $59,225 | $6,125 | $53,100 |
| 2016 | $157 | $6,125 | $6,125 | $0 |
| 2015 | $157 | $6,125 | $6,125 | $0 |
| 2014 | $157 | $6,125 | $6,125 | $0 |
Source: Public Records
Map
Nearby Homes
- 844 Big Cedar Dr
- 76 Big Cedar Dr
- 30 Big Cedar Dr
- 0 Bill Pope Dr
- 515 Old Us Highway 28
- 19 Lower Brow Rd
- 16 Old State Hwy 28
- 500 Old Highway 28
- 91 Hidden View Dr
- 91 Lightning Ln
- 100 River Dr
- 121 River Dr
- 63 River Dr
- 125 River Dr
- 35 River Ridge Dr
- 48 River Dr
- 50 River Dr
- 0 Dry Branch Way
- Lot 35 River Ridge Dr
- 59.73 Ac Windridge Dr
- 43 Blue Sewanee Rd
- 451 Big Cedar Dr
- 536 Blue Sewanee Rd
- 516 Blue Sewanee Rd
- 29 Golf Villa Dr
- 29 Golf Villa Dr
- 506 Big Cedar Dr
- 411 Big Cedar Dr
- 484 Blue Sewanee Rd
- 526 Big Cedar Dr
- 608 Blue Sewanee Rd
- 219 Big Cedar Dr
- 526 Big Cedar Dr
- 42 Blue Sewanee Rd
- 608 Blue Sewanee Rd
- 545 Blue Sewanee Rd
- 82 Golf Villa Dr
- 82 Golf Villa Dr Unit 201
- 32 Golf Villa Dr
- 201 Golf Villa Dr
Your Personal Tour Guide
Ask me questions while you tour the home.