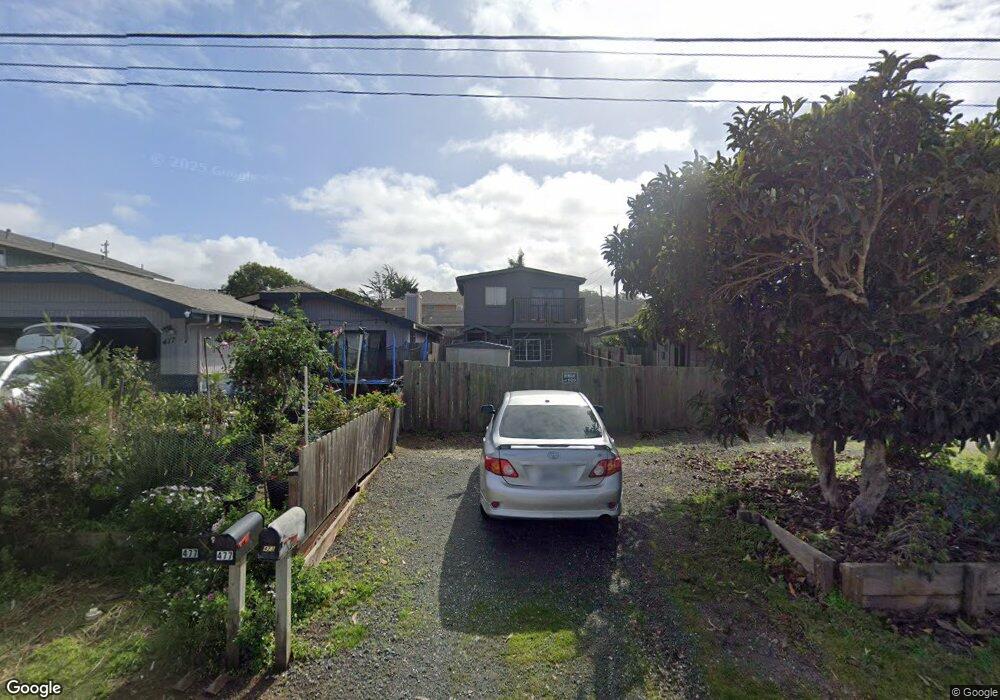
473 Binscarth Rd Los Osos, CA 93402
Estimated Value: $770,510 - $870,000
3
Beds
2
Baths
1,300
Sq Ft
$624/Sq Ft
Est. Value
About This Home
This home is located at 473 Binscarth Rd, Los Osos, CA 93402 and is currently estimated at $810,628, approximately $623 per square foot. 473 Binscarth Rd is a home located in San Luis Obispo County with nearby schools including Monarch Grove Elementary School, Los Osos Middle School, and Morro Bay High School.
Ownership History
Date
Name
Owned For
Owner Type
Purchase Details
Closed on
Oct 29, 2009
Sold by
Mcdonald Christine
Bought by
Weiss Christine Mcdonald
Current Estimated Value
Purchase Details
Closed on
Jun 17, 2003
Sold by
Mcdonald David
Bought by
Mcdonald Christine
Purchase Details
Closed on
Mar 5, 1999
Sold by
Lawhon Norma M
Bought by
Mcdonald David M and Mcdonald Christine
Purchase Details
Closed on
Mar 1, 1996
Sold by
Lawhon Norma
Bought by
Lawhon Norma M
Home Financials for this Owner
Home Financials are based on the most recent Mortgage that was taken out on this home.
Original Mortgage
$65,000
Interest Rate
7.01%
Purchase Details
Closed on
Nov 2, 1993
Sold by
Horton Helen Jeanette
Bought by
Lawhon Norma
Create a Home Valuation Report for This Property
The Home Valuation Report is an in-depth analysis detailing your home's value as well as a comparison with similar homes in the area
Home Values in the Area
Average Home Value in this Area
Purchase History
We collect this data history from publicly available records. To have your information removed, we recommend requesting removal directly through your county’s website.
| Date | Buyer | Sale Price | Title Company |
|---|---|---|---|
| Weiss Christine Mcdonald | -- | None Available | |
| Mcdonald Christine | -- | Chicago Title Company | |
| Mcdonald David M | $74,000 | First American Title Ins Co | |
| Lawhon Norma M | -- | First American Title Ins Co | |
| Lawhon Norma | -- | -- |
Source: Public Records
Mortgage History
We collect this data history from publicly available records. To have your information removed, we recommend requesting removal directly through your county’s website.
| Date | Status | Borrower | Loan Amount |
|---|---|---|---|
| Previous Owner | Lawhon Norma M | $65,000 |
Source: Public Records
Tax History
| Year | Tax Paid | Tax Assessment Tax Assessment Total Assessment is a certain percentage of the fair market value that is determined by local assessors to be the total taxable value of land and additions on the property. | Land | Improvement |
|---|---|---|---|---|
| 2025 | $5,634 | $216,318 | $125,404 | $90,914 |
| 2024 | $5,376 | $212,078 | $122,946 | $89,132 |
| 2023 | $5,376 | $207,921 | $120,536 | $87,385 |
| 2022 | $5,125 | $203,845 | $118,173 | $85,672 |
| 2021 | $4,968 | $199,849 | $115,856 | $83,993 |
| 2020 | $4,626 | $197,801 | $114,669 | $83,132 |
| 2019 | $4,555 | $193,923 | $112,421 | $81,502 |
| 2018 | $4,495 | $190,121 | $110,217 | $79,904 |
| 2017 | $4,532 | $186,394 | $108,056 | $78,338 |
| 2016 | $3,006 | $182,740 | $105,938 | $76,802 |
| 2015 | $2,976 | $179,996 | $104,347 | $75,649 |
| 2014 | $2,808 | $176,471 | $102,303 | $74,168 |
Source: Public Records
Map
Nearby Homes
- 1766 Fearn Ave
- 550 Mitchell Dr
- 1840 Pine Ave
- 1830 Pine Ave
- 0 Ash St
- 1850 Doris Ave
- 487 Henrietta Ave
- 0 Garden St
- 633 Ramona Ave Unit 97
- 633 Ramona Ave Unit 26
- 633 Ramona Ave
- 1717 5th St
- 611 Los Osos Valley Rd
- 1406 5th St
- 230 Butte Dr
- 701 Los Osos Valley Rd
- 1738 7th St
- 224 Butte Dr
- 701 Woodland Dr
- 1924 Nevada Ct
Your Personal Tour Guide
Ask me questions while you tour the home.