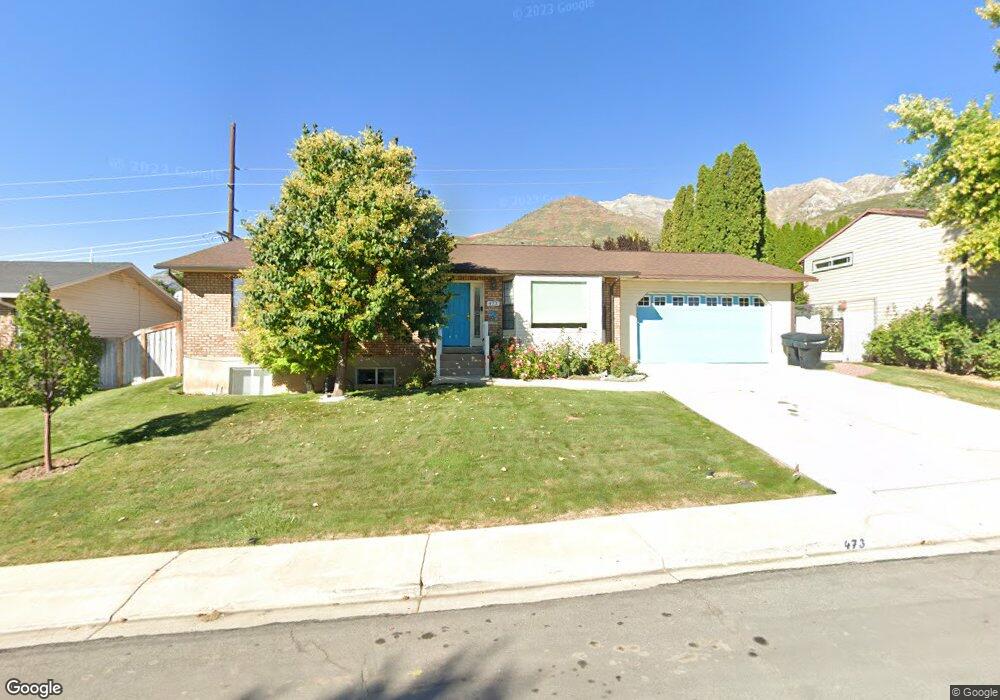
473 E 1930 N Orem, UT 84097
Northridge NeighborhoodEstimated Value: $615,000 - $712,000
5
Beds
3
Baths
3,093
Sq Ft
$208/Sq Ft
Est. Value
About This Home
This home is located at 473 E 1930 N, Orem, UT 84097 and is currently estimated at $644,409, approximately $208 per square foot. 473 E 1930 N is a home located in Utah County with nearby schools including Northridge Elementary School, Oak Canyon Junior High School, and Timpanogos High School.
Ownership History
Date
Name
Owned For
Owner Type
Purchase Details
Closed on
Aug 19, 2024
Sold by
Johnson Mark E and Johnson Patty A
Bought by
Mark And Patty Johnson Living Trust and Johnson
Current Estimated Value
Purchase Details
Closed on
Nov 5, 2004
Sold by
Johnson Patty A
Bought by
Johnson Patty A and Johnson Mark E
Home Financials for this Owner
Home Financials are based on the most recent Mortgage that was taken out on this home.
Original Mortgage
$191,500
Interest Rate
6.5%
Mortgage Type
New Conventional
Purchase Details
Closed on
Jun 24, 2002
Sold by
Johnson Mark E and Johnson Patty A
Bought by
Johnson Patty A
Create a Home Valuation Report for This Property
The Home Valuation Report is an in-depth analysis detailing your home's value as well as a comparison with similar homes in the area
Home Values in the Area
Average Home Value in this Area
Purchase History
| Date | Buyer | Sale Price | Title Company |
|---|---|---|---|
| Mark And Patty Johnson Living Trust | -- | None Listed On Document | |
| Johnson Patty A | -- | Executive Title | |
| Johnson Patty A | -- | Inwest Title Services Inc |
Source: Public Records
Mortgage History
| Date | Status | Borrower | Loan Amount |
|---|---|---|---|
| Previous Owner | Johnson Patty A | $191,500 |
Source: Public Records
Tax History
| Year | Tax Paid | Tax Assessment Tax Assessment Total Assessment is a certain percentage of the fair market value that is determined by local assessors to be the total taxable value of land and additions on the property. | Land | Improvement |
|---|---|---|---|---|
| 2025 | $2,484 | $331,870 | -- | -- |
| 2024 | $2,334 | $303,710 | $0 | $0 |
| 2023 | $2,334 | $306,735 | $0 | $0 |
| 2022 | $2,342 | $298,210 | $0 | $0 |
| 2021 | $2,101 | $405,100 | $152,600 | $252,500 |
| 2020 | $1,950 | $369,600 | $122,100 | $247,500 |
| 2019 | $1,711 | $337,300 | $122,100 | $215,200 |
| 2018 | $1,717 | $323,300 | $115,200 | $208,100 |
| 2017 | $1,572 | $158,620 | $0 | $0 |
| 2016 | $1,582 | $147,125 | $0 | $0 |
| 2015 | $1,564 | $137,555 | $0 | $0 |
| 2014 | $1,536 | $134,475 | $0 | $0 |
Source: Public Records
Map
Nearby Homes
- 110 S 1320 E
- 540 E Quail Rd
- 695 E 1870 N
- 1636 N 160 E
- 1638 N 160 E
- 1480 N 430 E
- 1643 N Mountain Oaks Dr
- 363 E 1395 N Unit 22
- 723 E 1450 N Unit 25
- 14 N 850 E
- 1051 E 100 N
- 49 W 1880 N
- 1371 N 330 E Unit 8
- 713 E 1500 St N Unit 19
- 120 N 950 E
- 713 E 1450 N Unit 23
- 747 E 1500 N Unit 13
- 1366 N 750 E
- 1356 N 750 E Unit 11
- 733 E 1450 N Unit 5
Your Personal Tour Guide
Ask me questions while you tour the home.