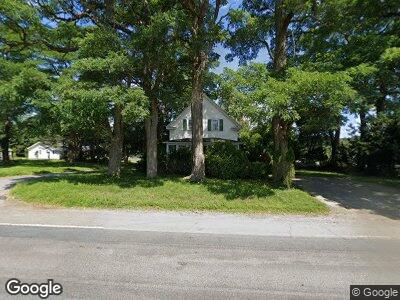
473 Main St Calais, ME 04619
Estimated Value: $170,000
--
Bed
--
Bath
--
Sq Ft
9,148
Sq Ft Lot
About This Home
This home is located at 473 Main St, Calais, ME 04619 and is currently estimated at $170,000. 473 Main St is a home located in Washington County with nearby schools including Calais Elementary School and Calais Middle/High School.
Ownership History
Date
Name
Owned For
Owner Type
Purchase Details
Closed on
Jun 24, 2021
Sold by
Machias Sb
Bought by
Calais Advertiser Inc
Current Estimated Value
Purchase Details
Closed on
Mar 24, 2017
Sold by
Howard 2Nd William W
Bought by
Jenroy Amy B and Jenroy Calvin A
Purchase Details
Closed on
Sep 22, 2011
Sold by
J D Thomas Inc
Bought by
Howard 3Rd William W
Create a Home Valuation Report for This Property
The Home Valuation Report is an in-depth analysis detailing your home's value as well as a comparison with similar homes in the area
Home Values in the Area
Average Home Value in this Area
Purchase History
| Date | Buyer | Sale Price | Title Company |
|---|---|---|---|
| Calais Advertiser Inc | -- | None Available | |
| Calais Advertiser Inc | -- | None Available | |
| Jenroy Amy B | -- | -- | |
| Jenroy Amy B | -- | -- | |
| Howard 3Rd William W | -- | -- | |
| Howard 3Rd William W | -- | -- |
Source: Public Records
Mortgage History
| Date | Status | Borrower | Loan Amount |
|---|---|---|---|
| Open | Calais Advertiser Inc | $59,200 | |
| Previous Owner | Jeanroy Calvin A | $60,000 |
Source: Public Records
Tax History Compared to Growth
Tax History
| Year | Tax Paid | Tax Assessment Tax Assessment Total Assessment is a certain percentage of the fair market value that is determined by local assessors to be the total taxable value of land and additions on the property. | Land | Improvement |
|---|---|---|---|---|
| 2024 | $1,788 | $119,200 | $44,100 | $75,100 |
| 2023 | $1,749 | $102,900 | $38,100 | $64,800 |
| 2022 | $1,579 | $83,100 | $30,700 | $52,400 |
| 2021 | $1,722 | $79,700 | $29,500 | $50,200 |
| 2020 | $1,723 | $68,100 | $25,200 | $42,900 |
| 2019 | $1,723 | $68,100 | $25,200 | $42,900 |
| 2018 | $1,723 | $68,100 | $25,200 | $42,900 |
| 2017 | $1,723 | $68,100 | $25,200 | $42,900 |
| 2016 | $1,723 | $68,100 | $25,200 | $42,900 |
| 2015 | $1,723 | $68,100 | $25,200 | $42,900 |
| 2014 | $1,723 | $68,100 | $25,200 | $42,900 |
| 2013 | $1,723 | $68,100 | $25,200 | $42,900 |
Source: Public Records
Map
Nearby Homes