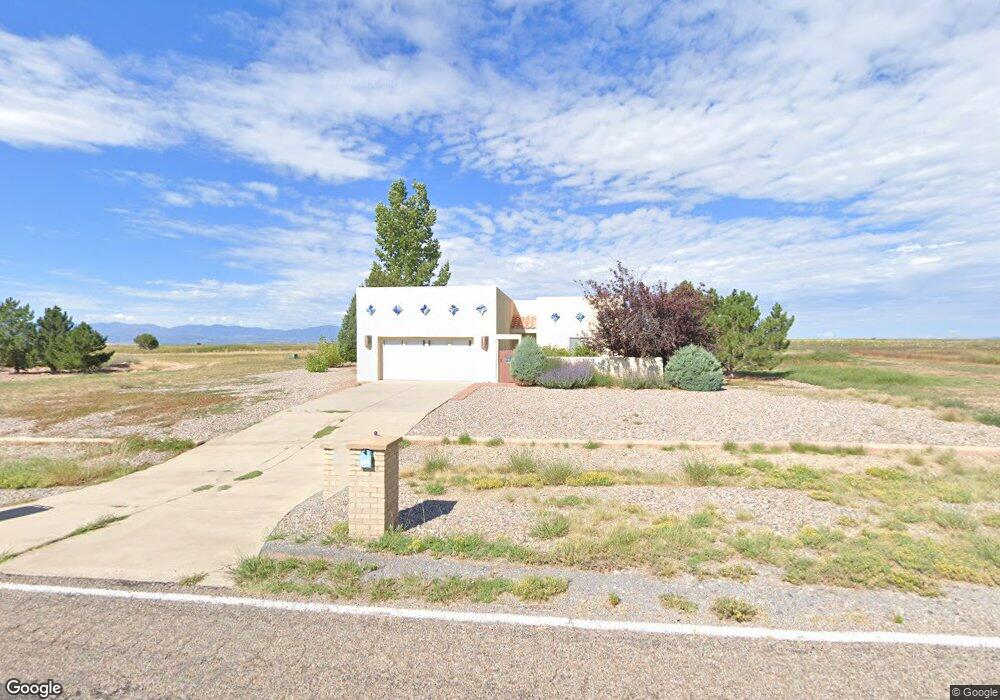
473 S Tejon Ave Pueblo, CO 81007
Estimated Value: $368,806 - $475,000
2
Beds
2
Baths
1,431
Sq Ft
$285/Sq Ft
Est. Value
About This Home
This home is located at 473 S Tejon Ave, Pueblo, CO 81007 and is currently estimated at $408,452, approximately $285 per square foot. 473 S Tejon Ave is a home located in Pueblo County with nearby schools including Cedar Ridge Elementary School, Sky View Middle School, and Pueblo West High School.
Ownership History
Date
Name
Owned For
Owner Type
Purchase Details
Closed on
Oct 27, 2011
Sold by
Hughes Gordon L and Hughes Marilyn S
Bought by
Steinworth Carolyn
Current Estimated Value
Purchase Details
Closed on
Oct 15, 2004
Sold by
Stevenart Dale
Bought by
Hughes Gordon L + Marilyn S
Purchase Details
Closed on
Jan 12, 2004
Sold by
Hughes Gordon + Marilyn
Bought by
Stevenart Dale
Purchase Details
Closed on
Oct 14, 2003
Sold by
Eaker Kenneth A + Roberta I
Bought by
Hughes Gordon + Marilyn
Purchase Details
Closed on
Nov 24, 1998
Sold by
Kastner Steven J
Bought by
Eaker Kenneth A + Roberta I
Purchase Details
Closed on
Jun 24, 1997
Sold by
Kastner Steven J
Bought by
Kastner Steven J
Purchase Details
Closed on
May 29, 1996
Bought by
Kastner Steven J
Purchase Details
Closed on
Mar 15, 1988
Purchase Details
Closed on
Jan 29, 1975
Sold by
Lawyers Title Of Pueblo
Create a Home Valuation Report for This Property
The Home Valuation Report is an in-depth analysis detailing your home's value as well as a comparison with similar homes in the area
Home Values in the Area
Average Home Value in this Area
Purchase History
| Date | Buyer | Sale Price | Title Company |
|---|---|---|---|
| Steinworth Carolyn | $179,000 | Stewart Title | |
| Hughes Gordon L + Marilyn S | $168,700 | -- | |
| Stevenart Dale | -- | -- | |
| Hughes Gordon + Marilyn | $17,500 | -- | |
| Eaker Kenneth A + Roberta I | $11,500 | -- | |
| Kastner Steven J | -- | -- | |
| Kastner Steven J | -- | -- | |
| -- | -- | -- | |
| -- | -- | -- |
Source: Public Records
Tax History Compared to Growth
Tax History
| Year | Tax Paid | Tax Assessment Tax Assessment Total Assessment is a certain percentage of the fair market value that is determined by local assessors to be the total taxable value of land and additions on the property. | Land | Improvement |
|---|---|---|---|---|
| 2024 | $1,053 | $17,070 | -- | -- |
| 2023 | $1,066 | $20,760 | $4,690 | $16,070 |
| 2022 | $807 | $14,898 | $2,570 | $12,328 |
| 2021 | $1,533 | $15,330 | $2,650 | $12,680 |
| 2020 | $1,458 | $15,330 | $2,650 | $12,680 |
| 2019 | $1,453 | $14,544 | $1,287 | $13,257 |
| 2018 | $1,349 | $13,493 | $1,296 | $12,197 |
| 2017 | $1,351 | $13,493 | $1,296 | $12,197 |
| 2016 | $1,375 | $13,757 | $1,433 | $12,324 |
| 2015 | $682 | $13,757 | $1,433 | $12,324 |
| 2014 | $670 | $13,513 | $1,433 | $12,080 |
Source: Public Records
Map
Nearby Homes
- 2094 W Woodstock Place
- 608 S Tejon Ave
- 2144 W Woodstock Dr
- 526 S Woodstock Dr
- 438 S Arriba Dr
- 488 S Escalante Dr
- 2054 W Locoweed Dr
- 313 S Montecito Dr
- 1867 W Costilla Dr
- 1837 W Costilla Plaza
- 275 S Hidalgo Dr
- 376 S Hidalgo Dr
- 567 S Chimazo Dr
- 573 S Chimazo Dr
- 706 S Carrizo Springs Ave
- 204 S Montecito Dr
- 556 S Chimazo Dr
- 721 S Carrizo Springs Ave
- 678 S Louviers Dr
- 2093 W Guadalupe Dr
- 473 S Tejon Ave Unit 8
- 492 S Tejon Ave Unit 15
- 477 S Tejon Ave
- 469 S Tejon Ave
- 468 S Tejon Ave
- 476 S Tejon Ave Unit 19
- 476 S Tejon Ave
- 481 S Tejon Ave
- 464 S Tejon Ave Unit 22
- 464 S Tejon Ave
- 448 S Tejon Ave
- 448 S Tejon Ave Unit 1
- 465 S Tejon Ave
- 480 S Tejon Ave
- 460 S Tejon Ave
- 485 S Tejon Ave
- 471 S Woodstock Dr Unit 6
- 484 S Tejon Ave
- 475 S Woodstock Dr
- 456 S Tejon Ave