Estimated Value: $420,000 - $448,000
3
Beds
2
Baths
1,500
Sq Ft
$288/Sq Ft
Est. Value
About This Home
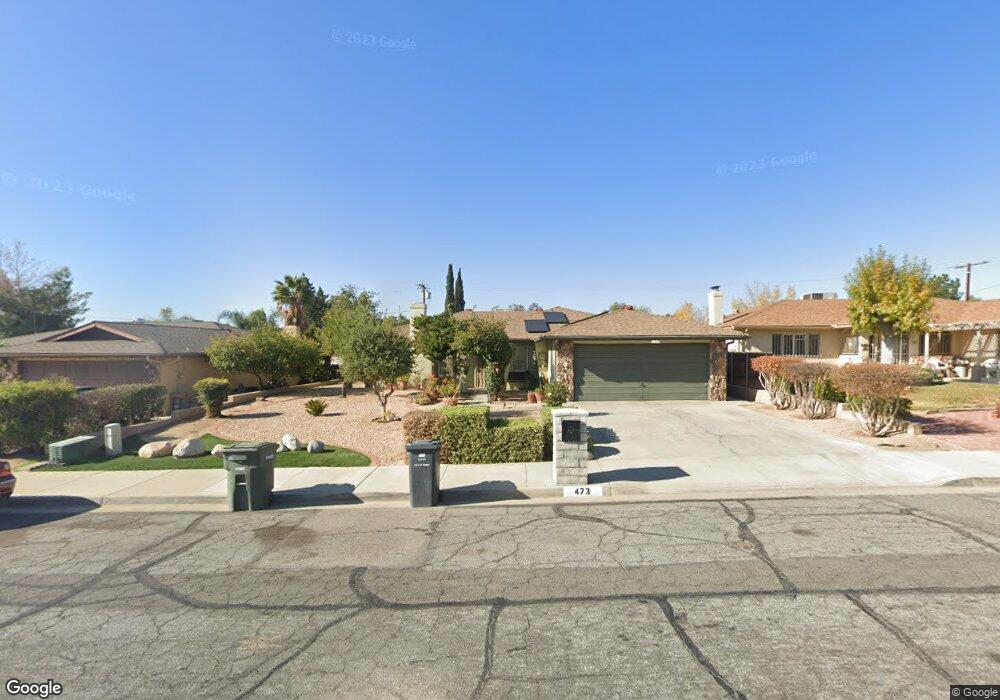
This home is located at 473 Whicha Way, Hemet, CA 92544 and is currently estimated at $431,511, approximately $287 per square foot. 473 Whicha Way is a home located in Riverside County with nearby schools including Jacob Wiens Elementary School, Rancho Viejo Middle School, and Tahquitz High School.
Ownership History
Date
Name
Owned For
Owner Type
Purchase Details
Closed on
Oct 29, 2024
Sold by
Yanez Herendira
Bought by
Erendira Living Trust
Current Estimated Value
Purchase Details
Closed on
May 24, 2004
Sold by
Yanez Jose Luis
Bought by
Yanez Herendira
Home Financials for this Owner
Home Financials are based on the most recent Mortgage that was taken out on this home.
Original Mortgage
$91,000
Interest Rate
5.92%
Mortgage Type
New Conventional
Purchase Details
Closed on
Jun 13, 1994
Sold by
Meyers Norman A and Meyers Norma L
Bought by
Yanez Herendira and Yanez Jose Luis
Home Financials for this Owner
Home Financials are based on the most recent Mortgage that was taken out on this home.
Original Mortgage
$59,000
Interest Rate
8.56%
Purchase Details
Closed on
Apr 18, 1994
Sold by
Hemet Professional Services Inc
Bought by
Meyers Norman A
Home Financials for this Owner
Home Financials are based on the most recent Mortgage that was taken out on this home.
Original Mortgage
$59,000
Interest Rate
8.56%
Create a Home Valuation Report for This Property
The Home Valuation Report is an in-depth analysis detailing your home's value as well as a comparison with similar homes in the area
Home Values in the Area
Average Home Value in this Area
Purchase History
| Date | Buyer | Sale Price | Title Company |
|---|---|---|---|
| Erendira Living Trust | -- | None Listed On Document | |
| Yanez Herendira | -- | Fidelity National Financial | |
| Yanez Herendira | $89,000 | Orange Coast Title Company | |
| Meyers Norman A | $106,117 | Chicago Title Company |
Source: Public Records
Mortgage History
| Date | Status | Borrower | Loan Amount |
|---|---|---|---|
| Previous Owner | Yanez Herendira | $91,000 | |
| Previous Owner | Yanez Herendira | $59,000 |
Source: Public Records
Tax History Compared to Growth
Tax History
| Year | Tax Paid | Tax Assessment Tax Assessment Total Assessment is a certain percentage of the fair market value that is determined by local assessors to be the total taxable value of land and additions on the property. | Land | Improvement |
|---|---|---|---|---|
| 2025 | $1,639 | $151,225 | $50,968 | $100,257 |
| 2023 | $1,639 | $145,355 | $48,990 | $96,365 |
| 2022 | $1,583 | $142,506 | $48,030 | $94,476 |
| 2021 | $1,556 | $139,713 | $47,089 | $92,624 |
| 2020 | $1,533 | $138,282 | $46,607 | $91,675 |
| 2019 | $1,499 | $135,572 | $45,694 | $89,878 |
| 2018 | $1,451 | $132,915 | $44,799 | $88,116 |
| 2017 | $1,432 | $130,310 | $43,921 | $86,389 |
| 2016 | $1,420 | $127,756 | $43,060 | $84,696 |
| 2015 | $1,415 | $125,839 | $42,414 | $83,425 |
| 2014 | $1,350 | $123,376 | $41,584 | $81,792 |
Source: Public Records
Map
Nearby Homes
- 425 Whicha Way
- 437 Romain Ct
- 2335 Park Ave
- 0 N Yale St
- 2154 Woodberry Ave
- 2351 E Devonshire Ave
- 511 Lavina Ct
- 621 Brian St
- 203 N Girard St
- 2655 E Devonshire Ave
- 201 Monte Vista Way
- 1400 E Menlo Ave Unit 86
- 1443 E Devonshire Ave
- 0 Alexander Dr Unit SW25226401
- 410 N San Jacinto St
- 608 N San Jacinto St
- 3260 Vista Way
- 40830 Acacia Ave
- 0 Acacia Ave Unit IV24052060
- 26044 Amy Ln
- 461 Whicha Way
- 485 Whicha Way
- 449 Whicha Way
- 497 Whicha Way
- 460 Kiitos Cir
- 2279 E Oakland Ave
- 450 Kiitos Cir
- 2353 Thata Way
- 440 Kiitos Cir
- 2350 Thata Way
- 437 Whicha Way
- 2255 E Oakland Ave
- 430 Kiitos Cir
- 2377 Thata Way
- 2376 Thata Way
- 2352 Thisa Way
- 2248 Le Grande Dr
- 2272 Le Grande Dr
- 2401 Thata Way
- 2402 Thata Way