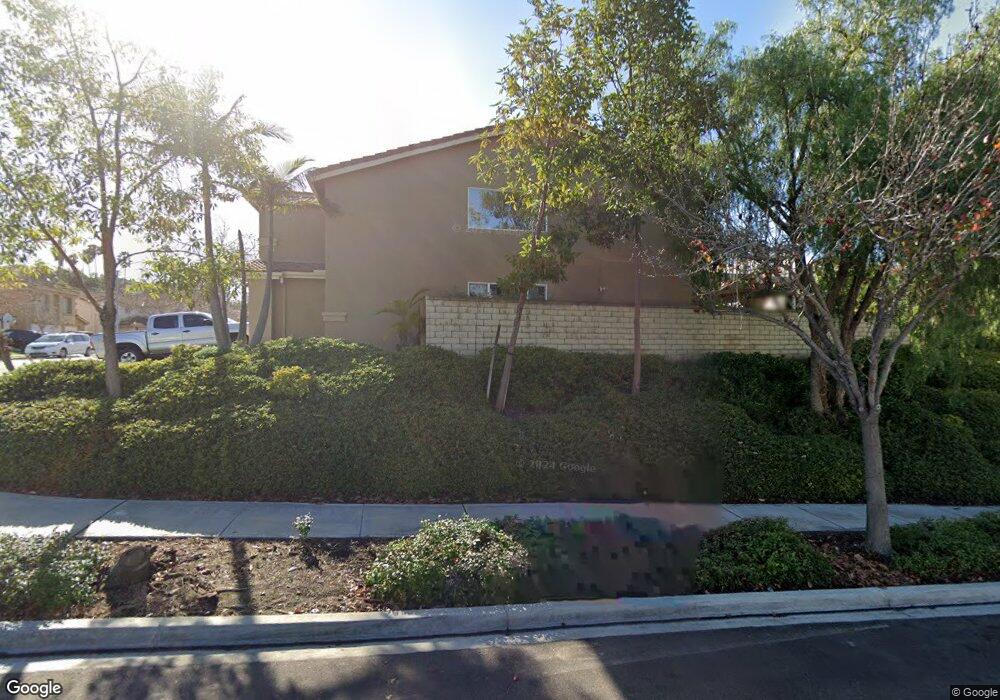
4730 Red Sails Way San Diego, CA 92154
Ocean View Hills NeighborhoodEstimated Value: $938,000 - $1,063,000
5
Beds
3
Baths
2,353
Sq Ft
$417/Sq Ft
Est. Value
About This Home
This home is located at 4730 Red Sails Way, San Diego, CA 92154 and is currently estimated at $980,696, approximately $416 per square foot. 4730 Red Sails Way is a home located in San Diego County with nearby schools including Juarez Lincoln Elementary School, Montgomery Middle School, and Montgomery Senior High School.
Ownership History
Date
Name
Owned For
Owner Type
Purchase Details
Closed on
Oct 4, 2016
Sold by
Figueroa Domingo and Figueroa Marilou
Bought by
Figueroa Marilou Apostol and Figueroa Domingo Rombaoa
Current Estimated Value
Purchase Details
Closed on
Aug 26, 2010
Sold by
Figueroa Domingo and Figueroa Marilou
Bought by
Figueroa Domingo and Figueroa Marilou
Home Financials for this Owner
Home Financials are based on the most recent Mortgage that was taken out on this home.
Original Mortgage
$200,000
Outstanding Balance
$132,535
Interest Rate
4.51%
Mortgage Type
New Conventional
Estimated Equity
$848,161
Purchase Details
Closed on
Jul 20, 1999
Sold by
Pardee Construction Co
Bought by
Figueroa Domingo and Figueroa Mairlou
Home Financials for this Owner
Home Financials are based on the most recent Mortgage that was taken out on this home.
Original Mortgage
$215,800
Interest Rate
7.63%
Create a Home Valuation Report for This Property
The Home Valuation Report is an in-depth analysis detailing your home's value as well as a comparison with similar homes in the area
Home Values in the Area
Average Home Value in this Area
Purchase History
| Date | Buyer | Sale Price | Title Company |
|---|---|---|---|
| Figueroa Marilou Apostol | -- | None Available | |
| Figueroa Domingo | -- | Stewart Title Of California | |
| Figueroa Domingo | $270,000 | Chicago Title |
Source: Public Records
Mortgage History
| Date | Status | Borrower | Loan Amount |
|---|---|---|---|
| Open | Figueroa Domingo | $200,000 | |
| Closed | Figueroa Domingo | $215,800 |
Source: Public Records
Tax History Compared to Growth
Tax History
| Year | Tax Paid | Tax Assessment Tax Assessment Total Assessment is a certain percentage of the fair market value that is determined by local assessors to be the total taxable value of land and additions on the property. | Land | Improvement |
|---|---|---|---|---|
| 2025 | $4,836 | $420,375 | $138,314 | $282,061 |
| 2024 | $4,836 | $412,133 | $135,602 | $276,531 |
| 2023 | $5,648 | $404,053 | $132,944 | $271,109 |
| 2022 | $5,487 | $396,132 | $130,338 | $265,794 |
| 2021 | $5,354 | $388,366 | $127,783 | $260,583 |
| 2020 | $5,224 | $384,385 | $126,473 | $257,912 |
| 2019 | $5,069 | $376,849 | $123,994 | $252,855 |
| 2018 | $4,982 | $369,461 | $121,563 | $247,898 |
| 2017 | $81 | $362,218 | $119,180 | $243,038 |
| 2016 | $4,758 | $355,117 | $116,844 | $238,273 |
| 2015 | $4,687 | $349,783 | $115,089 | $234,694 |
| 2014 | $4,604 | $342,932 | $112,835 | $230,097 |
Source: Public Records
Map
Nearby Homes
- 1166 Sea Bird Way Unit 3D
- 4821 Sea Water Ln
- 5118 Mariner Dr
- 321 Rancho Dr Unit 45
- 4250 Lemonseed Dr
- 751 Anchor Cove
- 5080 Sea Reef Place
- 782 Anchor Cove
- 843 Compass Way
- 4205 Rene Dr
- 5192 Emerald Cove
- 1721 Melrose Ave Unit 16
- 1737 Melrose Ave Unit 63
- 1721 Melrose Ave Unit 15
- 4325 Darwin Way
- 237 Rancho Dr Unit C
- 1720 Melrose Ave Unit 27
- 1677 Melrose Ave Unit H
- 1378 Starry Way
- 0 Future Airway Rd Unit Tr 1267 Lot 27
- 4726 Red Sails Way
- 4722 Red Sails Way Unit 1B
- 563 Offshore Point
- 4726 Regatta Ln
- 4704 Red Sails Way
- 4724 Regatta Ln
- 4731 Red Sails Way Unit 1B
- 4727 Red Sails Way
- 4728 Regatta Ln
- 4723 Red Sails Way
- 558 Offshore Point
- 588 Sea Isle Dr
- 4720 Regatta Ln
- 652 Offshore Point
- 4718 Regatta Ln
- 582 Sea Isle Dr
- 4719 Red Sails Way
- 562 Offshore Point
- 4716 Regatta Ln
- 4737 Regatta Ln