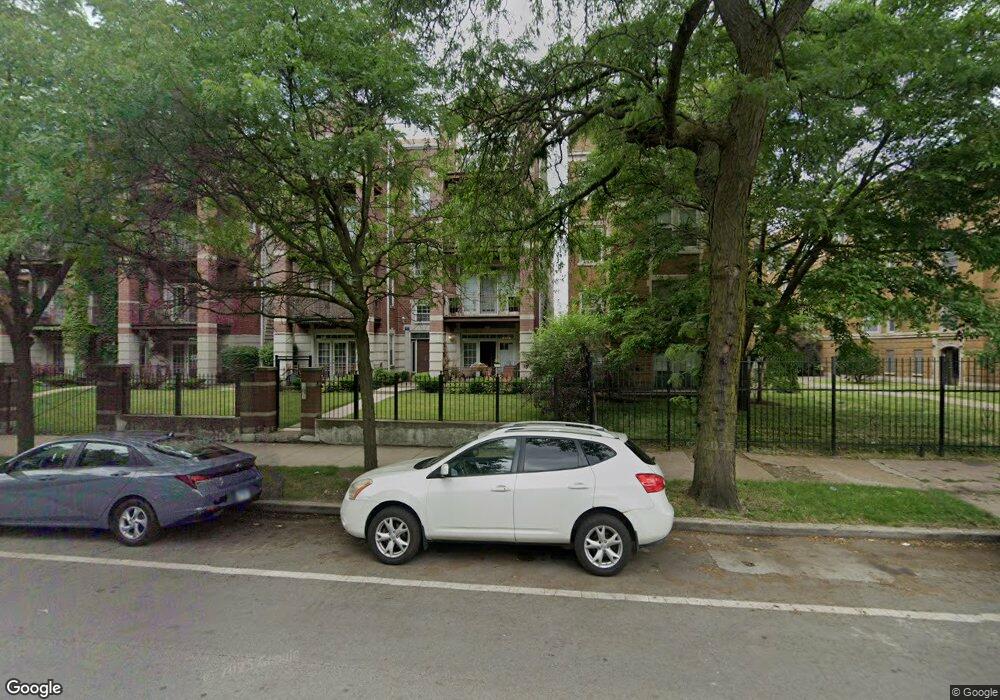
4730 S Drexel Blvd Unit 3S Chicago, IL 60615
Kenwood NeighborhoodEstimated Value: $298,513 - $441,000
3
Beds
2
Baths
1,800
Sq Ft
$200/Sq Ft
Est. Value
About This Home
This home is located at 4730 S Drexel Blvd Unit 3S, Chicago, IL 60615 and is currently estimated at $360,628, approximately $200 per square foot. 4730 S Drexel Blvd Unit 3S is a home located in Cook County with nearby schools including Reavis Elementary Math & Science Specialty School, Kenwood Academy High School, and The UChicago Charter School - North Kenwood/Oakland.
Ownership History
Date
Name
Owned For
Owner Type
Purchase Details
Closed on
Jan 31, 2006
Sold by
Williams Porscha
Bought by
Bell Angela
Current Estimated Value
Home Financials for this Owner
Home Financials are based on the most recent Mortgage that was taken out on this home.
Original Mortgage
$180,000
Outstanding Balance
$101,932
Interest Rate
6.3%
Mortgage Type
Fannie Mae Freddie Mac
Estimated Equity
$258,696
Purchase Details
Closed on
Dec 17, 2004
Sold by
Mclaughlin Elvin and Mclaughlin Alicia N
Bought by
Williams Porscha
Home Financials for this Owner
Home Financials are based on the most recent Mortgage that was taken out on this home.
Original Mortgage
$216,000
Interest Rate
5.37%
Mortgage Type
New Conventional
Create a Home Valuation Report for This Property
The Home Valuation Report is an in-depth analysis detailing your home's value as well as a comparison with similar homes in the area
Home Values in the Area
Average Home Value in this Area
Purchase History
| Date | Buyer | Sale Price | Title Company |
|---|---|---|---|
| Bell Angela | $320,000 | Chicago Title Insurance Co | |
| Williams Porscha | $270,000 | -- |
Source: Public Records
Mortgage History
| Date | Status | Borrower | Loan Amount |
|---|---|---|---|
| Open | Bell Angela | $180,000 | |
| Previous Owner | Williams Porscha | $216,000 | |
| Closed | Williams Porscha | $40,500 |
Source: Public Records
Tax History Compared to Growth
Tax History
| Year | Tax Paid | Tax Assessment Tax Assessment Total Assessment is a certain percentage of the fair market value that is determined by local assessors to be the total taxable value of land and additions on the property. | Land | Improvement |
|---|---|---|---|---|
| 2024 | $4,379 | $27,289 | $4,801 | $22,488 |
| 2023 | $4,232 | $24,000 | $4,801 | $19,199 |
| 2022 | $4,232 | $24,000 | $4,801 | $19,199 |
| 2021 | $4,156 | $23,998 | $4,800 | $19,198 |
| 2020 | $4,422 | $23,418 | $2,331 | $21,087 |
| 2019 | $4,499 | $25,821 | $2,331 | $23,490 |
| 2018 | $4,422 | $25,821 | $2,331 | $23,490 |
| 2017 | $3,258 | $18,511 | $1,920 | $16,591 |
| 2016 | $3,207 | $18,511 | $1,920 | $16,591 |
| 2015 | $2,911 | $18,511 | $1,920 | $16,591 |
| 2014 | $3,276 | $20,223 | $1,646 | $18,577 |
| 2013 | $3,200 | $20,223 | $1,646 | $18,577 |
Source: Public Records
Map
Nearby Homes
- 814 E 48th St
- 829 E 48th St Unit D
- 827 E 48th St Unit C
- 4810 S Drexel Blvd Unit G
- 4740 S Ingleside Ave Unit 2N
- 4714 S Evans Ave Unit 3N
- 4757 S Langley Ave
- 4824 S Evans Ave
- 835 E 49th St Unit 3
- 4634 S Langley Ave
- 4546 S Cottage Grove Ave
- 4743 S Champlain Ave
- 928 E 46th St
- 4537 S Drexel Blvd Unit 504
- 4537 S Drexel Blvd Unit 303
- 4537 S Drexel Blvd Unit 706
- 4541 S Evans Ave Unit 2
- 4537 S Evans Ave
- 4926 S Drexel Blvd Unit C
- 4730 S Champlain Ave Unit 3
- 4730 S Drexel Blvd
- 4730 S Drexel Blvd Unit 3N
- 4730 S Drexel Blvd Unit 2N
- 4730 S Drexel Blvd Unit 4N
- 4730 S Drexel Blvd Unit 2S
- 4730 S Drexel Blvd Unit 1S
- 4730 S Drexel Blvd Unit 1N
- 4730 S Drexel Blvd Unit 2
- 4732 S Drexel Blvd
- 4732 S Drexel Blvd Unit 2S
- 4732 S Drexel Blvd Unit 4S
- 4732 S Drexel Blvd Unit 3S
- 4732 S Drexel Blvd Unit 1S
- 4732 S Drexel Blvd Unit 2S
- 4734 S Drexel Blvd Unit 2S
- 4734 S Drexel Blvd Unit 1S
- 4734 S Drexel Blvd Unit 1N
- 4734 S Drexel Blvd Unit 4N
- 4734 S Drexel Blvd Unit 2S
- 4734 S Drexel Blvd Unit 3S