4731 S Ingleside Ave Unit C1 Chicago, IL 60615
Kenwood NeighborhoodEstimated Value: $211,000 - $314,000
2
Beds
3
Baths
1,600
Sq Ft
$162/Sq Ft
Est. Value
About This Home
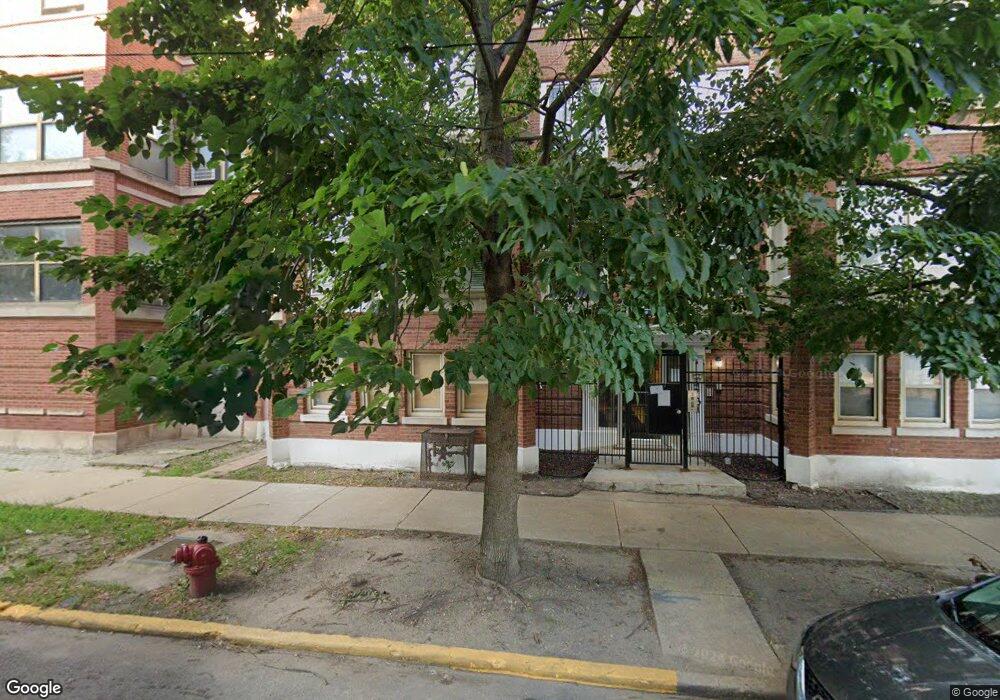
This home is located at 4731 S Ingleside Ave Unit C1, Chicago, IL 60615 and is currently estimated at $259,183, approximately $161 per square foot. 4731 S Ingleside Ave Unit C1 is a home located in Cook County with nearby schools including Reavis Elementary Math & Science Specialty School, Kenwood Academy High School, and The UChicago Charter School - North Kenwood/Oakland.
Ownership History
Date
Name
Owned For
Owner Type
Purchase Details
Closed on
Dec 7, 2011
Sold by
Mosley Kinzie
Bought by
Randle Nikkita S
Current Estimated Value
Home Financials for this Owner
Home Financials are based on the most recent Mortgage that was taken out on this home.
Original Mortgage
$38,800
Outstanding Balance
$26,542
Interest Rate
4.01%
Mortgage Type
New Conventional
Estimated Equity
$232,641
Purchase Details
Closed on
Jan 6, 2011
Sold by
Federal Home Loan Mortgage Corporation
Bought by
Mosley Kinzie
Purchase Details
Closed on
Sep 20, 2010
Sold by
Ojelade Rilwan
Bought by
Federal Home Loan Mortgage Corp
Purchase Details
Closed on
Mar 22, 2007
Sold by
4731 South Ingleside Development Llc
Bought by
Ojelade Riliwan
Home Financials for this Owner
Home Financials are based on the most recent Mortgage that was taken out on this home.
Original Mortgage
$66,000
Interest Rate
6.25%
Mortgage Type
Stand Alone Second
Create a Home Valuation Report for This Property
The Home Valuation Report is an in-depth analysis detailing your home's value as well as a comparison with similar homes in the area
Home Values in the Area
Average Home Value in this Area
Purchase History
| Date | Buyer | Sale Price | Title Company |
|---|---|---|---|
| Randle Nikkita S | $40,000 | Ctic | |
| Mosley Kinzie | $27,000 | 1St American Title | |
| Federal Home Loan Mortgage Corp | -- | None Available | |
| Ojelade Riliwan | $330,000 | Success Title Services Inc | |
| Ojelade Riliwan | $330,000 | Success Title Services Inc |
Source: Public Records
Mortgage History
| Date | Status | Borrower | Loan Amount |
|---|---|---|---|
| Open | Randle Nikkita S | $38,800 | |
| Previous Owner | Ojelade Riliwan | $66,000 | |
| Previous Owner | Ojelade Riliwan | $264,000 |
Source: Public Records
Tax History Compared to Growth
Tax History
| Year | Tax Paid | Tax Assessment Tax Assessment Total Assessment is a certain percentage of the fair market value that is determined by local assessors to be the total taxable value of land and additions on the property. | Land | Improvement |
|---|---|---|---|---|
| 2024 | $1,839 | $23,000 | $4,561 | $18,439 |
| 2023 | $1,764 | $12,000 | $3,678 | $8,322 |
| 2022 | $1,764 | $12,000 | $3,678 | $8,322 |
| 2021 | $1,743 | $11,999 | $3,678 | $8,321 |
| 2020 | $1,482 | $9,756 | $2,942 | $6,814 |
| 2019 | $1,446 | $10,625 | $2,942 | $7,683 |
| 2018 | $1,420 | $10,625 | $2,942 | $7,683 |
| 2017 | $1,716 | $11,348 | $2,427 | $8,921 |
| 2016 | $1,773 | $11,348 | $2,427 | $8,921 |
| 2015 | $1,599 | $11,348 | $2,427 | $8,921 |
| 2014 | $2,975 | $18,605 | $1,986 | $16,619 |
| 2013 | $3,384 | $18,605 | $1,986 | $16,619 |
Source: Public Records
Map
Nearby Homes
- 4721 S Ingleside Ave
- 4719 S Ingleside Ave
- 4717 S Ingleside Ave
- 4740 S Ingleside Ave Unit 2N
- 829 E 48th St Unit D
- 4730 S Greenwood Ave
- 827 E 48th St Unit C
- 4810 S Drexel Blvd Unit G
- 814 E 48th St
- 928 E 46th St
- 4553 S Ellis Ave
- 556 E 47th St
- 4537 S Drexel Blvd Unit 706
- 4537 S Drexel Blvd Unit 504
- 4537 S Drexel Blvd Unit 303
- 4529 S Drexel Blvd Unit 452912
- 4527 S Drexel Blvd Unit 3S
- 4527 S Drexel Blvd Unit 1W
- 4714 S Evans Ave Unit 3N
- 4757 S Langley Ave
- 4731 S Ingleside Ave Unit B3
- 4731 S Ingleside Ave Unit A3
- 4731 S Ingleside Ave Unit C2
- 4731 S Ingleside Ave Unit A1
- 4731 S Ingleside Ave Unit A2
- 4731 S Ingleside Ave Unit B2
- 4731 S Ingleside Ave Unit D1
- 4731 S Ingleside Ave Unit B1
- 4731 S Ingleside Ave Unit 3S
- 4731 S Ingleside Ave
- 4731 S Ingleside Ave Unit 3A
- 4725 S Ingleside Ave
- 4737 S Ingleside Ave
- 4743 S Ingleside Ave
- 4728 S Ellis Ave
- 4719-21 S Ingleside Ave
- 4719 S Ingleside Ave Unit C
- 4719 S Ingleside Ave Unit B
- 4719 S Ingleside Ave Unit A
- 4745 S Ingleside Ave