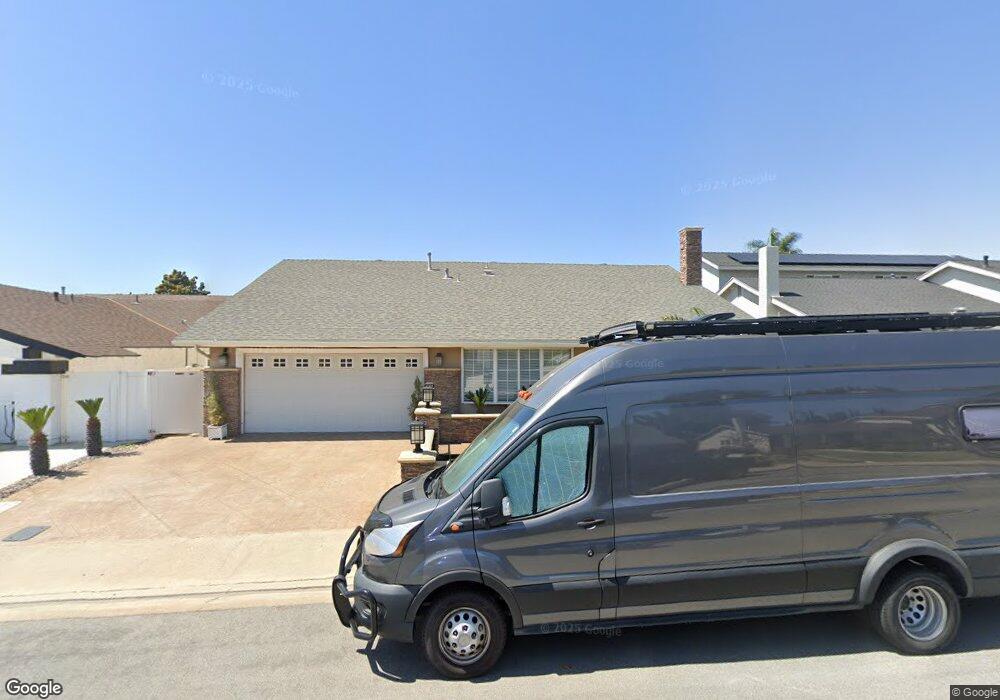
4731 Via Del Rancho Yorba Linda, CA 92886
Estimated Value: $920,000 - $1,262,000
4
Beds
2
Baths
1,715
Sq Ft
$649/Sq Ft
Est. Value
About This Home
This home is located at 4731 Via Del Rancho, Yorba Linda, CA 92886 and is currently estimated at $1,112,234, approximately $648 per square foot. 4731 Via Del Rancho is a home located in Orange County with nearby schools including Fairmont Elementary, Bernardo Yorba Middle School, and Yorba Linda High School.
Ownership History
Date
Name
Owned For
Owner Type
Purchase Details
Closed on
Sep 21, 2013
Sold by
Gilson Maria T
Bought by
Gilson Maria T and Gilson Warren Family Trust
Current Estimated Value
Purchase Details
Closed on
Jul 14, 2003
Sold by
Warren Richard
Bought by
Gilson Mari T
Home Financials for this Owner
Home Financials are based on the most recent Mortgage that was taken out on this home.
Original Mortgage
$173,000
Interest Rate
5.15%
Mortgage Type
Purchase Money Mortgage
Purchase Details
Closed on
Aug 22, 2001
Sold by
Gilson Maria T and Warren Richard
Bought by
Warren Richard and Gilson Maria T
Home Financials for this Owner
Home Financials are based on the most recent Mortgage that was taken out on this home.
Original Mortgage
$185,500
Interest Rate
7.21%
Purchase Details
Closed on
Oct 22, 1998
Sold by
Maria Gilson
Bought by
Gilson Maria T and Warren Richard
Purchase Details
Closed on
Jul 17, 1995
Sold by
Gilson Paul T
Bought by
Gilson Maria Theresa Y
Create a Home Valuation Report for This Property
The Home Valuation Report is an in-depth analysis detailing your home's value as well as a comparison with similar homes in the area
Home Values in the Area
Average Home Value in this Area
Purchase History
| Date | Buyer | Sale Price | Title Company |
|---|---|---|---|
| Gilson Maria T | -- | None Available | |
| Gilson Mari T | -- | Ticor Title Company | |
| Warren Richard | -- | Equity Title Company | |
| Gilson Maria T | -- | Orange Coast Title Companies | |
| Gilson Maria Theresa Y | -- | -- |
Source: Public Records
Mortgage History
| Date | Status | Borrower | Loan Amount |
|---|---|---|---|
| Closed | Gilson Mari T | $173,000 | |
| Closed | Warren Richard | $185,500 |
Source: Public Records
Tax History Compared to Growth
Tax History
| Year | Tax Paid | Tax Assessment Tax Assessment Total Assessment is a certain percentage of the fair market value that is determined by local assessors to be the total taxable value of land and additions on the property. | Land | Improvement |
|---|---|---|---|---|
| 2025 | $5,315 | $450,368 | $326,488 | $123,880 |
| 2024 | $5,315 | $441,538 | $320,087 | $121,451 |
| 2023 | $5,214 | $432,881 | $313,811 | $119,070 |
| 2022 | $5,155 | $424,394 | $307,658 | $116,736 |
| 2021 | $5,061 | $416,073 | $301,625 | $114,448 |
| 2020 | $4,959 | $411,807 | $298,532 | $113,275 |
| 2019 | $4,789 | $403,733 | $292,679 | $111,054 |
| 2018 | $4,729 | $395,817 | $286,940 | $108,877 |
| 2017 | $4,653 | $388,056 | $281,313 | $106,743 |
| 2016 | $4,561 | $380,448 | $275,798 | $104,650 |
| 2015 | $4,505 | $374,734 | $271,655 | $103,079 |
| 2014 | $4,374 | $367,394 | $266,334 | $101,060 |
Source: Public Records
Map
Nearby Homes
- 4545 Avenida Rio Del Oro
- 91 VAC/COR E Avenue L
- 19841 Lombardy Ln
- 4446 Avenida de Las Flores
- 19831 Caprice Dr
- 4418 Avenida Del Este
- 4362 Via Alegre
- 4774 Serrente Plaza
- 19862 Le Mans Cir
- 4741 Cardena Plaza
- 20100 Livorno Ln
- 5289 Via Andalusia
- 21590 Via Pepita
- 19369 Easy St
- 4154 Princeton Place
- 4066 Villa Quintana
- 19426 Via Del Caballo
- 20455 Via Cadiz
- 19762 Ridgewood Place
- 20000 Villa Torino
- 4721 Via Del Rancho
- 4741 Via Del Rancho
- 4732 Via la Quinta
- 4722 Via la Quinta
- 4711 Via Del Rancho
- 4742 Via la Quinta
- 4732 Via Del Rancho
- 4712 Via la Quinta
- 4742 Via Del Rancho
- 4722 Via Del Rancho
- 4673 Via Del Rancho
- 4761 Via Alameda
- 4674 Via la Quinta
- 4712 Via Del Rancho
- 4966 Via Alameda
- 4663 Via Del Rancho
- 4663 Vía Del Rancho
- 4674 Via Del Rancho
- 4664 Via la Quinta
- 4777 Via Alameda