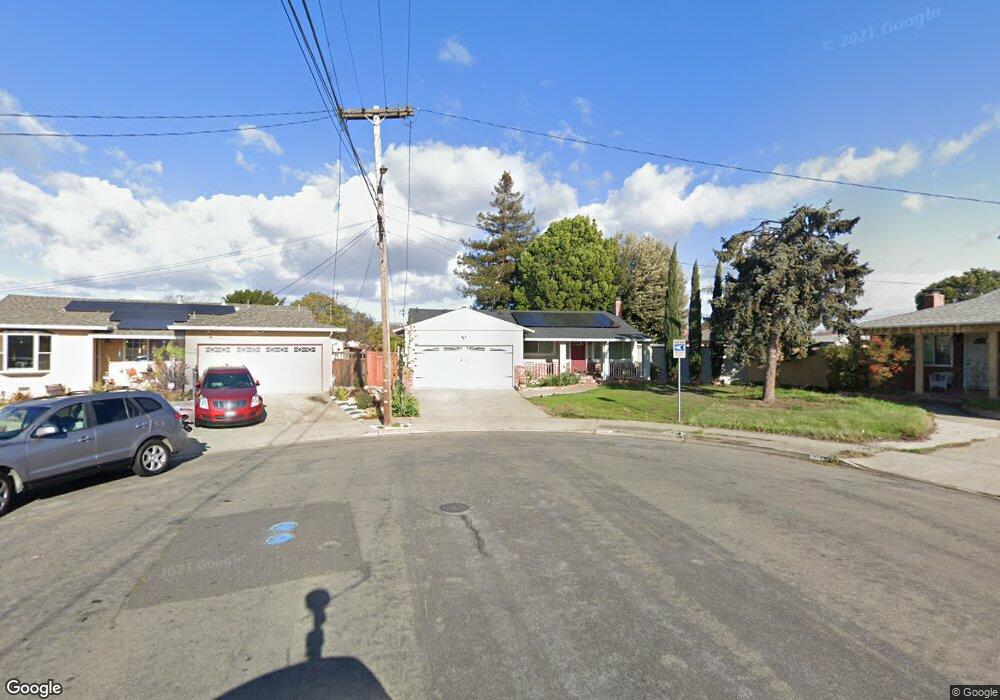
4732 La Mesa Ct Fremont, CA 94536
Estimated Value: $1,283,000 - $1,396,601
3
Beds
2
Baths
1,150
Sq Ft
$1,147/Sq Ft
Est. Value
About This Home
This home is located at 4732 La Mesa Ct, Fremont, CA 94536 and is currently estimated at $1,319,400, approximately $1,147 per square foot. 4732 La Mesa Ct is a home located in Alameda County with nearby schools including Cabrillo Elementary School, Centerville Junior High School, and Washington High School.
Ownership History
Date
Name
Owned For
Owner Type
Purchase Details
Closed on
May 7, 2018
Sold by
Nardo Raymundo M and Nardo Maria J
Bought by
Nardo Raymundo M and Nardo Maria J
Current Estimated Value
Purchase Details
Closed on
Feb 1, 2011
Sold by
Cbs Finance Inc
Bought by
Nardo Maria Jennifer and Nardo Raymundo
Home Financials for this Owner
Home Financials are based on the most recent Mortgage that was taken out on this home.
Original Mortgage
$438,592
Outstanding Balance
$310,169
Interest Rate
5.5%
Mortgage Type
FHA
Estimated Equity
$1,009,231
Purchase Details
Closed on
Oct 25, 2010
Sold by
Anand Pramod
Bought by
Cbs Finance Inc
Purchase Details
Closed on
Aug 11, 2010
Sold by
Anand Anshu
Bought by
Anand Pramod
Purchase Details
Closed on
Aug 9, 2010
Sold by
Flock Shirley A
Bought by
Anand Pramod
Create a Home Valuation Report for This Property
The Home Valuation Report is an in-depth analysis detailing your home's value as well as a comparison with similar homes in the area
Home Values in the Area
Average Home Value in this Area
Purchase History
| Date | Buyer | Sale Price | Title Company |
|---|---|---|---|
| Nardo Raymundo M | -- | None Available | |
| Nardo Maria Jennifer | $450,000 | Old Republic Title Company | |
| Cbs Finance Inc | -- | None Available | |
| Anand Pramod | -- | Fidelity National Title Co | |
| Anand Pramod | $350,000 | Fidelity National Title Co |
Source: Public Records
Mortgage History
| Date | Status | Borrower | Loan Amount |
|---|---|---|---|
| Open | Nardo Maria Jennifer | $438,592 |
Source: Public Records
Tax History Compared to Growth
Tax History
| Year | Tax Paid | Tax Assessment Tax Assessment Total Assessment is a certain percentage of the fair market value that is determined by local assessors to be the total taxable value of land and additions on the property. | Land | Improvement |
|---|---|---|---|---|
| 2025 | $7,144 | $569,494 | $172,948 | $403,546 |
| 2024 | $7,144 | $558,194 | $169,558 | $395,636 |
| 2023 | $6,945 | $554,115 | $166,234 | $387,881 |
| 2022 | $6,844 | $536,253 | $162,976 | $380,277 |
| 2021 | $6,678 | $525,601 | $159,780 | $372,821 |
| 2020 | $6,662 | $527,143 | $158,143 | $369,000 |
| 2019 | $6,587 | $516,811 | $155,043 | $361,768 |
| 2018 | $6,456 | $506,681 | $152,004 | $354,677 |
| 2017 | $6,294 | $496,750 | $149,025 | $347,725 |
| 2016 | $6,181 | $487,011 | $146,103 | $340,908 |
| 2015 | $6,094 | $479,700 | $143,910 | $335,790 |
| 2014 | $5,984 | $470,303 | $141,091 | $329,212 |
Source: Public Records
Map
Nearby Homes
- 36304 Magellan Dr
- 36347 Magellan Dr
- 36139 San Pedro Dr
- 35978 Magellan Dr
- 4955 Swindon Place
- 36521 Cabrillo Dr
- 35936 Magellan Dr
- 36202 Worthing Dr
- 35942 Adobe Dr
- 36288 Saxon Ct
- 35856 Adobe Dr
- 4987 Winchester Place
- 4626 Alhambra Dr
- 5139 Dryden Ct
- 4632 Balboa Way
- 4412 Elaiso Common
- 4543 Bartolo Terrace
- 5093 Dorking Ct
- 36686 Charles St
- 36720 Charles St
- 4740 La Mesa Ct
- 4733 La Mesa Ct
- 36239 Pizarro Dr
- 36233 Pizarro Dr
- 36311 Pizarro Dr
- 36209 Pizarro Dr
- 36323 Pizarro Dr
- 4748 La Mesa Ct
- 4741 La Mesa Ct
- 36329 Pizarro Dr
- 36155 Pizarro Dr
- 4749 La Mesa Ct
- 36335 Pizarro Dr
- 4756 La Mesa Ct
- 36147 Pizarro Dr
- 36343 Pizarro Dr
- 4763 La Mesa Ct
- 4718 Baffin Ave
- 4726 Baffin Ave
- 4768 La Mesa Ct