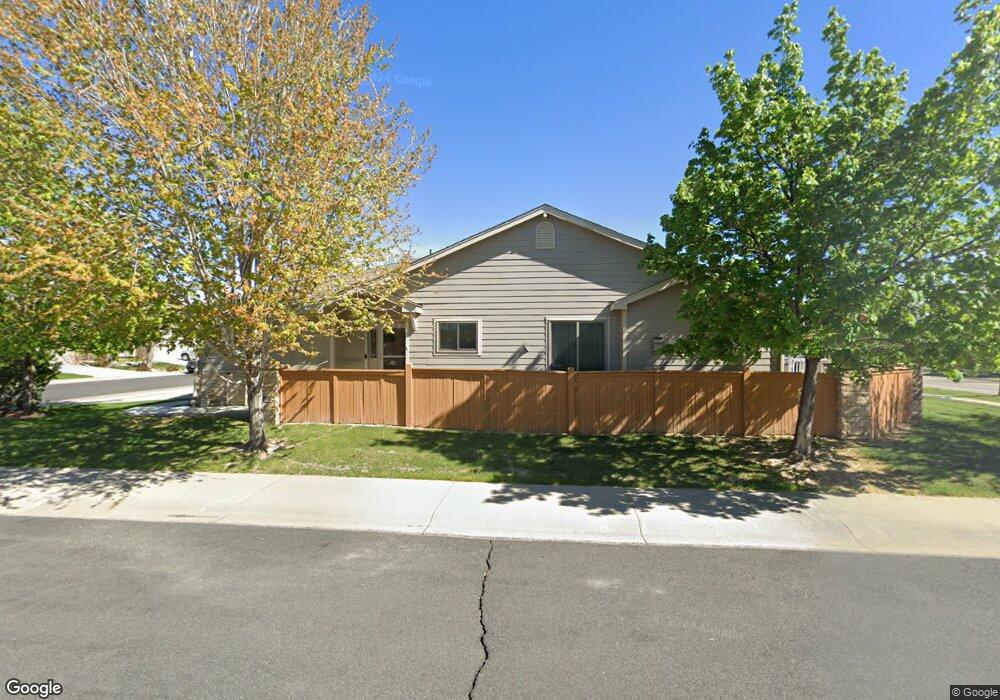
4732 Parachute Cir Loveland, CO 80538
Estimated Value: $450,842 - $533,000
3
Beds
3
Baths
2,630
Sq Ft
$184/Sq Ft
Est. Value
About This Home
This home is located at 4732 Parachute Cir, Loveland, CO 80538 and is currently estimated at $484,461, approximately $184 per square foot. 4732 Parachute Cir is a home located in Larimer County with nearby schools including Centennial Elementary School, Lucile Erwin Middle School, and Loveland High School.
Ownership History
Date
Name
Owned For
Owner Type
Purchase Details
Closed on
Sep 16, 2015
Sold by
Kemper John A and Kemper Mary A
Bought by
Kemper Living Trust
Current Estimated Value
Purchase Details
Closed on
Sep 18, 2007
Sold by
Baker Bruce G and Baker Marsha A
Bought by
Kemper Mary A and Kemper John A
Purchase Details
Closed on
Dec 15, 2006
Sold by
Baker Bruce G and Baker Marsha A
Bought by
Baker Bruce G and Baker Marsha A
Purchase Details
Closed on
Aug 19, 2005
Sold by
Drury Craig M
Bought by
Baker Bruce G and Baker Marsha A
Purchase Details
Closed on
Jan 31, 2003
Sold by
Lincoln Spencer Largo Family Trust
Bought by
Drury Craig M
Home Financials for this Owner
Home Financials are based on the most recent Mortgage that was taken out on this home.
Original Mortgage
$159,920
Interest Rate
5.9%
Mortgage Type
Balloon
Create a Home Valuation Report for This Property
The Home Valuation Report is an in-depth analysis detailing your home's value as well as a comparison with similar homes in the area
Home Values in the Area
Average Home Value in this Area
Purchase History
| Date | Buyer | Sale Price | Title Company |
|---|---|---|---|
| Kemper Living Trust | $500 | None Available | |
| Kemper Mary A | $230,000 | None Available | |
| Baker Bruce G | -- | None Available | |
| Baker Bruce G | $220,000 | Land Title Guarantee Company | |
| Drury Craig M | $199,000 | Chicago Title Co |
Source: Public Records
Mortgage History
| Date | Status | Borrower | Loan Amount |
|---|---|---|---|
| Previous Owner | Drury Craig M | $159,920 |
Source: Public Records
Tax History Compared to Growth
Tax History
| Year | Tax Paid | Tax Assessment Tax Assessment Total Assessment is a certain percentage of the fair market value that is determined by local assessors to be the total taxable value of land and additions on the property. | Land | Improvement |
|---|---|---|---|---|
| 2025 | $1,719 | $31,926 | $8,576 | $23,350 |
| 2024 | $1,658 | $31,926 | $8,576 | $23,350 |
| 2022 | $1,563 | $26,598 | $2,294 | $24,304 |
| 2021 | $1,606 | $27,364 | $2,360 | $25,004 |
| 2020 | $1,504 | $26,069 | $2,360 | $23,709 |
| 2019 | $1,479 | $26,069 | $2,360 | $23,709 |
| 2018 | $1,405 | $24,271 | $2,376 | $21,895 |
| 2017 | $1,720 | $24,271 | $2,376 | $21,895 |
| 2016 | $1,460 | $19,900 | $2,627 | $17,273 |
| 2015 | $1,448 | $20,520 | $2,630 | $17,890 |
| 2014 | $1,470 | $19,550 | $2,630 | $16,920 |
Source: Public Records
Map
Nearby Homes
- 2015 Massachusetts St
- 4559 Keota Place
- 2308 Winter Park St
- 2349 Paonia St
- 2050 Alabama St
- 1905 Massachusetts St
- 2250 W 44th St
- 2597 W 46th St
- 5042 Stonewall St
- 5001 Avon Ave
- 2070 Tonopas Ct
- 1734 W 50th St
- 2684 W 46th St
- 2643 W 45th St
- Zion Plan at Eagle Brook Meadows
- 5037 Avon Ave
- Acadia Plan at Eagle Brook Meadows
- Glacier Plan at Eagle Brook Meadows
- Sequoia Plan at Eagle Brook Meadows
- Rainier Plan at Eagle Brook Meadows
- 4736 Parachute Cir
- 4740 Parachute Cir
- 4744 Parachute Cir
- 4707 Parachute Cir
- 4703 Parachute Cir
- 4711 Parachute Cir
- 4711 Parachute Cir Unit 1
- 4748 Parachute Cir
- 4735 Parachute Cir
- 4731 Parachute Cir
- 4715 Parachute Cir
- 4715 Parachute Cir Unit 2
- 4739 Parachute Cir
- 4727 Parachute Cir
- 4752 Parachute Cir
- 4743 Parachute Cir
- 4719 Parachute Cir
- 4723 Parachute Cir
- 4747 Parachute Cir
- 4756 Parachute Cir