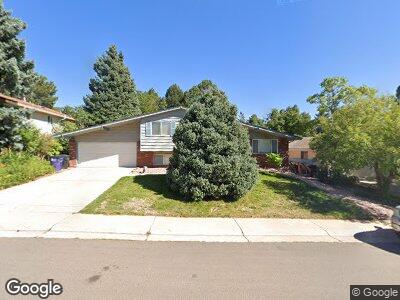
4732 S Xenia St Denver, CO 80237
Hampden South NeighborhoodEstimated Value: $615,000 - $734,000
4
Beds
2
Baths
2,286
Sq Ft
$305/Sq Ft
Est. Value
About This Home
This home is located at 4732 S Xenia St, Denver, CO 80237 and is currently estimated at $697,529, approximately $305 per square foot. 4732 S Xenia St is a home located in Denver County with nearby schools including Samuels Elementary School, Holm Elementary School, and Joe Shoemaker School.
Ownership History
Date
Name
Owned For
Owner Type
Purchase Details
Closed on
Apr 29, 2020
Sold by
Feiten Jonathan and Varner Megan
Bought by
Feiten Jonathan and Feiten Mean
Current Estimated Value
Home Financials for this Owner
Home Financials are based on the most recent Mortgage that was taken out on this home.
Original Mortgage
$297,500
Outstanding Balance
$266,492
Interest Rate
3.3%
Mortgage Type
New Conventional
Estimated Equity
$415,125
Purchase Details
Closed on
Aug 13, 2015
Sold by
Robinson Gregory S
Bought by
Feiten Jonathan and Varner Megan
Home Financials for this Owner
Home Financials are based on the most recent Mortgage that was taken out on this home.
Original Mortgage
$318,000
Interest Rate
4.08%
Mortgage Type
New Conventional
Purchase Details
Closed on
Sep 28, 1999
Sold by
Lasater Rand A and Kathleen Holcombe
Bought by
Robinson Gregory S
Home Financials for this Owner
Home Financials are based on the most recent Mortgage that was taken out on this home.
Original Mortgage
$21,682
Interest Rate
8.5%
Mortgage Type
Unknown
Create a Home Valuation Report for This Property
The Home Valuation Report is an in-depth analysis detailing your home's value as well as a comparison with similar homes in the area
Home Values in the Area
Average Home Value in this Area
Purchase History
| Date | Buyer | Sale Price | Title Company |
|---|---|---|---|
| Feiten Jonathan | -- | Canyon Title | |
| Feiten Jonathan | $397,500 | Fidelity National Title | |
| Robinson Gregory S | $214,000 | -- |
Source: Public Records
Mortgage History
| Date | Status | Borrower | Loan Amount |
|---|---|---|---|
| Open | Feiten Jonathan | $297,500 | |
| Closed | Feiten Jonathan | $318,000 | |
| Previous Owner | Robinson Gregory S | $150,000 | |
| Previous Owner | Robinson Gregory S | $49,000 | |
| Previous Owner | Robinson Gregory S | $190,000 | |
| Previous Owner | Robinson Gregory S | $21,682 | |
| Previous Owner | Robinson Gregory S | $171,200 | |
| Previous Owner | Malouff Leatrice | $81,300 |
Source: Public Records
Tax History Compared to Growth
Tax History
| Year | Tax Paid | Tax Assessment Tax Assessment Total Assessment is a certain percentage of the fair market value that is determined by local assessors to be the total taxable value of land and additions on the property. | Land | Improvement |
|---|---|---|---|---|
| 2024 | $3,406 | $43,000 | $5,670 | $37,330 |
| 2023 | $3,332 | $43,000 | $5,670 | $37,330 |
| 2022 | $2,526 | $31,760 | $9,710 | $22,050 |
| 2021 | $2,438 | $32,670 | $9,990 | $22,680 |
| 2020 | $2,306 | $31,080 | $9,990 | $21,090 |
| 2019 | $2,241 | $31,080 | $9,990 | $21,090 |
| 2018 | $2,173 | $28,090 | $6,710 | $21,380 |
| 2017 | $2,167 | $28,090 | $6,710 | $21,380 |
| 2016 | $2,476 | $30,360 | $5,930 | $24,430 |
| 2015 | $2,372 | $30,360 | $5,930 | $24,430 |
| 2014 | $2,021 | $24,330 | $6,368 | $17,962 |
Source: Public Records
Map
Nearby Homes
- 8632 E Layton Ave
- 4605 S Yosemite St Unit 36
- 4605 S Yosemite St Unit 39
- 4605 S Yosemite St Unit C-301
- 4505 S Yosemite St Unit 106
- 4505 S Yosemite St Unit 102
- 4505 S Yosemite St Unit 125
- 4505 S Yosemite St Unit 371
- 4505 S Yosemite St Unit 433
- 8690 E Chenango Ave
- 8917 E Chenango Ave
- 8561 E Grand Ave
- 4530 S Verbena St Unit 316
- 4530 S Verbena St Unit 309
- 9196 E Stanford Place
- 4991 S Beeler St
- 4401 S Yosemite Ct
- 8100 E Union Ave Unit 2201
- 8100 E Union Ave Unit 409
- 8100 E Union Ave Unit 614
- 4732 S Xenia St
- 4722 S Xenia St
- 4742 S Xenia St
- 4712 S Xenia St
- 4752 S Xenia St
- 4731 S Xenia St
- 4721 S Xenia St
- 4741 S Xenia St
- 4711 S Xenia St
- 4762 S Xenia St
- 4702 S Xenia St
- 4761 S Xenia St
- 4701 S Xenia St
- 4772 S Xenia St
- 4720 S Xanthia St
- 4771 S Xenia St
- 4730 S Xanthia St
- 4740 S Xanthia St
- 4710 S Xanthia St
- 8700 E Union Ave