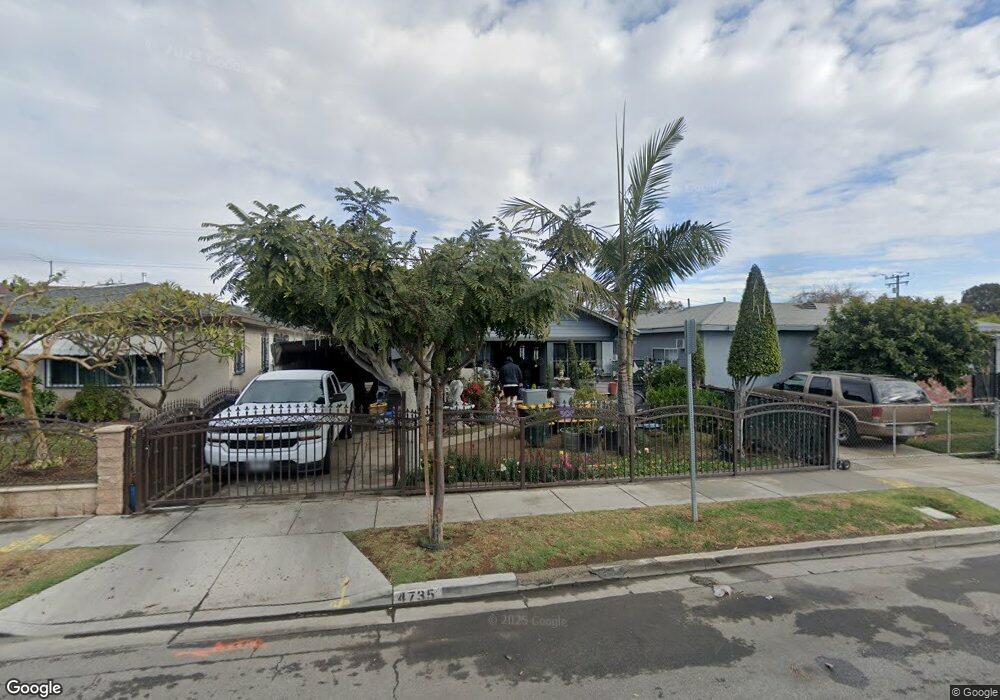
4735 E 60th St Maywood, CA 90270
Estimated Value: $551,002 - $598,000
2
Beds
1
Bath
912
Sq Ft
$635/Sq Ft
Est. Value
About This Home
This home is located at 4735 E 60th St, Maywood, CA 90270 and is currently estimated at $578,751, approximately $634 per square foot. 4735 E 60th St is a home located in Los Angeles County with nearby schools including Heliotrope Avenue Elementary School, Chester W. Nimitz Middle School, and Maywood Academy High School.
Ownership History
Date
Name
Owned For
Owner Type
Purchase Details
Closed on
Sep 16, 2010
Sold by
Rosales Jose Luis
Bought by
Rosales Jose Luis and Rosales Matilde
Current Estimated Value
Purchase Details
Closed on
Jul 20, 2001
Sold by
Rosales Jose Luis and Rosales Matilde
Bought by
Rosales Jose Luis
Home Financials for this Owner
Home Financials are based on the most recent Mortgage that was taken out on this home.
Original Mortgage
$118,000
Outstanding Balance
$45,011
Interest Rate
7%
Estimated Equity
$533,740
Purchase Details
Closed on
May 23, 1996
Sold by
Summers Glenna S
Bought by
Summers Glenna S and The Summers Living Trust
Purchase Details
Closed on
Jun 18, 1994
Sold by
Summers Glenna S
Bought by
Rosales Jose Luis and Rosales Remedios
Home Financials for this Owner
Home Financials are based on the most recent Mortgage that was taken out on this home.
Original Mortgage
$124,233
Interest Rate
8.32%
Mortgage Type
FHA
Create a Home Valuation Report for This Property
The Home Valuation Report is an in-depth analysis detailing your home's value as well as a comparison with similar homes in the area
Home Values in the Area
Average Home Value in this Area
Purchase History
| Date | Buyer | Sale Price | Title Company |
|---|---|---|---|
| Rosales Jose Luis | -- | None Available | |
| Rosales Jose Luis | -- | First American Title Ins Co | |
| Summers Glenna S | -- | Gateway Title Company | |
| Rosales Jose Luis | $125,000 | Fidelity National Title Ins |
Source: Public Records
Mortgage History
| Date | Status | Borrower | Loan Amount |
|---|---|---|---|
| Open | Rosales Jose Luis | $118,000 | |
| Previous Owner | Rosales Jose Luis | $124,233 |
Source: Public Records
Tax History
| Year | Tax Paid | Tax Assessment Tax Assessment Total Assessment is a certain percentage of the fair market value that is determined by local assessors to be the total taxable value of land and additions on the property. | Land | Improvement |
|---|---|---|---|---|
| 2025 | $3,535 | $233,682 | $144,373 | $89,309 |
| 2024 | $3,535 | $229,101 | $141,543 | $87,558 |
| 2023 | $3,476 | $224,610 | $138,768 | $85,842 |
| 2022 | $3,333 | $220,207 | $136,048 | $84,159 |
| 2021 | $3,291 | $215,890 | $133,381 | $82,509 |
| 2019 | $3,191 | $209,488 | $129,426 | $80,062 |
| 2018 | $3,095 | $205,382 | $126,889 | $78,493 |
| 2016 | $2,896 | $197,408 | $121,962 | $75,446 |
| 2015 | $2,733 | $194,444 | $120,131 | $74,313 |
| 2014 | $2,733 | $190,636 | $117,778 | $72,858 |
Source: Public Records
Map
Nearby Homes
- 5824 Heliotrope Ave
- 4909 E 59th Place
- 6122 Wilcox Ave
- 6152 Wilcox Ave
- 6033 Clarkson Ave
- 4539 E 53rd St
- 5606 Pine Ave
- 4301 E 60th St
- 5362 E Slauson Ave
- 4212 E 58th St
- 4313 E 55th St
- 6621 Crafton Ave
- 4101 E 57th St
- 6518 Walker Ave
- 6720 Sherman Way
- 6600 Fishburn Ave
- 6833 Crafton Ave
- 5202 Gifford Ave
- 6011 Bear Ave
- 4026 Gage Ave
- 5977 Heliotrope Cir
- 4729 E 60th St
- 5939 Heliotrope Cir
- 4725 E 60th St
- 4740 E 60th St
- 5959 Heliotrope Cir
- 4723 E 60th St
- 6006 Vinevale Ave
- 6009 Heliotrope Ave
- 5957 Heliotrope Cir
- 4721 E 60th St
- 6010 Vinevale Ave
- 4726 E 59th Place
- 6003 Vinevale Ave
- 4717 E 60th St
- 6011 Heliotrope Ave
- 4720 E 59th Place
- 6007 Vinevale Ave
- 6014 Vinevale Ave
- 4801 E 60th St