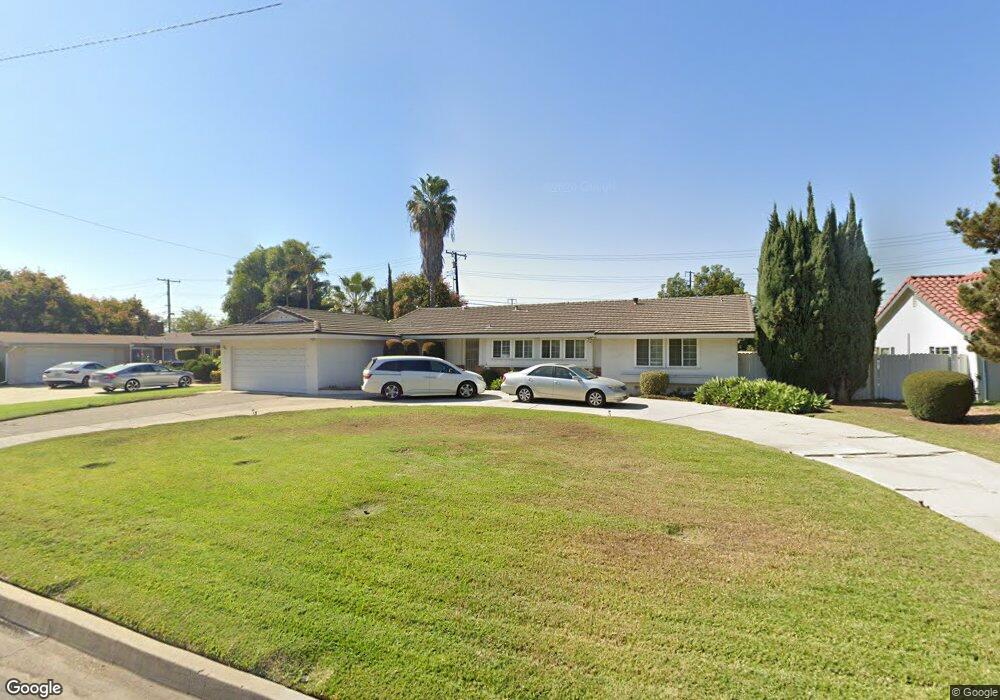
4735 Saint Andrews Ave Buena Park, CA 90621
Estimated Value: $1,329,000 - $1,475,641
3
Beds
2
Baths
1,733
Sq Ft
$824/Sq Ft
Est. Value
About This Home
This home is located at 4735 Saint Andrews Ave, Buena Park, CA 90621 and is currently estimated at $1,428,160, approximately $824 per square foot. 4735 Saint Andrews Ave is a home located in Orange County with nearby schools including Charles G. Emery Elementary School, Buena Park Junior High School, and Sunny Hills High School.
Ownership History
Date
Name
Owned For
Owner Type
Purchase Details
Closed on
Jul 1, 2009
Sold by
Kim Shi Chul and Kim Chul Hee
Bought by
Kim Shi Chul and Kim Kwang Ju
Current Estimated Value
Purchase Details
Closed on
May 7, 1998
Sold by
Andrew Kim and Andrew Bong
Bought by
Kim Shi Chul and Kim Chul Hee
Home Financials for this Owner
Home Financials are based on the most recent Mortgage that was taken out on this home.
Original Mortgage
$157,500
Outstanding Balance
$22,665
Interest Rate
3.95%
Estimated Equity
$1,405,495
Purchase Details
Closed on
May 5, 1995
Sold by
Nelson Kurt J
Bought by
Kim Andrew Y and Kim Bong Sun
Home Financials for this Owner
Home Financials are based on the most recent Mortgage that was taken out on this home.
Original Mortgage
$120,000
Interest Rate
8.36%
Create a Home Valuation Report for This Property
The Home Valuation Report is an in-depth analysis detailing your home's value as well as a comparison with similar homes in the area
Home Values in the Area
Average Home Value in this Area
Purchase History
| Date | Buyer | Sale Price | Title Company |
|---|---|---|---|
| Kim Shi Chul | -- | None Available | |
| Kim Shi Chul | $210,000 | North American Title Co | |
| Kim Andrew Y | $240,500 | Stewart Title |
Source: Public Records
Mortgage History
| Date | Status | Borrower | Loan Amount |
|---|---|---|---|
| Open | Kim Shi Chul | $157,500 | |
| Previous Owner | Kim Andrew Y | $120,000 |
Source: Public Records
Tax History Compared to Growth
Tax History
| Year | Tax Paid | Tax Assessment Tax Assessment Total Assessment is a certain percentage of the fair market value that is determined by local assessors to be the total taxable value of land and additions on the property. | Land | Improvement |
|---|---|---|---|---|
| 2025 | $9,386 | $848,759 | $274,329 | $574,430 |
| 2024 | $9,386 | $832,117 | $268,950 | $563,167 |
| 2023 | $4,527 | $383,681 | $263,677 | $120,004 |
| 2022 | $4,453 | $376,158 | $258,507 | $117,651 |
| 2021 | $4,420 | $368,783 | $253,438 | $115,345 |
| 2020 | $4,366 | $365,002 | $250,839 | $114,163 |
| 2019 | $4,264 | $357,846 | $245,921 | $111,925 |
| 2018 | $4,183 | $350,830 | $241,099 | $109,731 |
| 2017 | $4,124 | $343,951 | $236,371 | $107,580 |
| 2016 | $4,042 | $337,207 | $231,736 | $105,471 |
| 2015 | $3,869 | $332,142 | $228,255 | $103,887 |
| 2014 | $3,856 | $325,636 | $223,784 | $101,852 |
Source: Public Records
Map
Nearby Homes
- 4738 Durango Dr
- 4900 Lincolnshire Ave
- 14806 Faceta Dr
- 14724 Mercado Ave
- 2150 Cheyenne Way Unit 169
- 8244 Henderson Green
- 14828 Rayfield Dr
- 2200 Cheyenne Way Unit 117
- 5211 Fox Hills Ave
- 15819 Rosalita Dr
- 15213 Santa Gertrudes Ave Unit W106
- 15233 Santa Gertrudes Ave
- 5412 Arrowhead Ave
- 15740 Rosalita Dr
- 14727 La Mesa Dr
- 15011 La Mesa Dr
- 15220 Ocaso Ave Unit H103
- 15224 Ocaso Ave Unit H212
- 14504 Manecita Dr
- 14111 El Mirador St
- 4751 Saint Andrews Ave
- 4715 Saint Andrews Ave
- 8248 Elliott Green
- 8244 Elliott Green
- 8240 Elliott Green
- 8241 Elliott Green
- 8245 Elliott Green
- 8249 Erskine Green
- 8237 Elliott Green
- 8249 Elliott Green
- 4771 Saint Andrews Ave
- 8236 Elliott Green
- 8245 Erskine Green
- 8241 Erskine Green
- 8232 Elliott Green
- 4744 Beach Blvd
- 8237 Erskine Green
- 4742 Beach Blvd
- 8233 Erskine Green
- 4720 Saint Andrews Ave