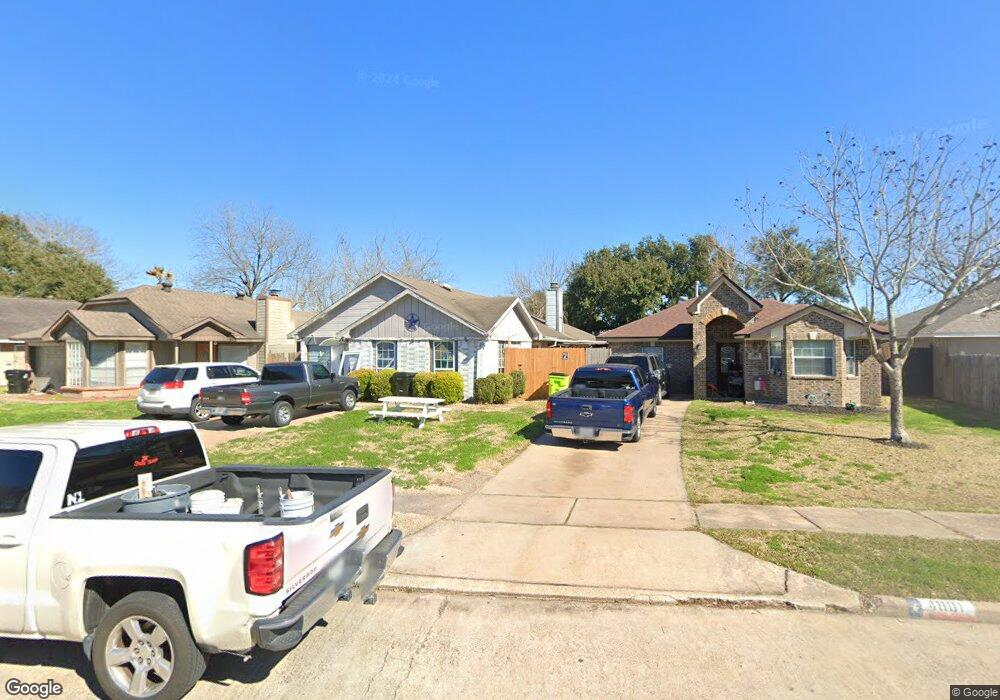
4737 Redbud Dr Rosenberg, TX 77471
Estimated Value: $185,000 - $244,000
3
Beds
2
Baths
1,722
Sq Ft
$126/Sq Ft
Est. Value
About This Home
This home is located at 4737 Redbud Dr, Rosenberg, TX 77471 and is currently estimated at $217,401, approximately $126 per square foot. 4737 Redbud Dr is a home located in Fort Bend County with nearby schools including Travis Elementary School, George Junior High School, and B.F. Terry High School.
Ownership History
Date
Name
Owned For
Owner Type
Purchase Details
Closed on
Jun 28, 2016
Sold by
Munguia Erica
Bought by
Rangel Joe Q and Rangel Audrey M
Current Estimated Value
Purchase Details
Closed on
Jun 25, 2016
Sold by
Arriaga Felisita
Bought by
Rangei Joe Q and Rangei Audrey M
Create a Home Valuation Report for This Property
The Home Valuation Report is an in-depth analysis detailing your home's value as well as a comparison with similar homes in the area
Home Values in the Area
Average Home Value in this Area
Purchase History
| Date | Buyer | Sale Price | Title Company |
|---|---|---|---|
| Rangel Joe Q | -- | None Available | |
| Rangei Joe Q | -- | None Available |
Source: Public Records
Tax History
| Year | Tax Paid | Tax Assessment Tax Assessment Total Assessment is a certain percentage of the fair market value that is determined by local assessors to be the total taxable value of land and additions on the property. | Land | Improvement |
|---|---|---|---|---|
| 2025 | $521 | $216,417 | $24,700 | $191,717 |
| 2024 | $521 | $204,672 | -- | $217,830 |
| 2023 | $467 | $186,065 | $0 | $225,219 |
| 2022 | $1,443 | $169,150 | $0 | $184,380 |
| 2021 | $3,190 | $153,770 | $19,000 | $134,770 |
| 2020 | $2,967 | $139,790 | $17,000 | $122,790 |
| 2019 | $3,270 | $143,190 | $17,000 | $126,190 |
| 2018 | $3,135 | $135,080 | $17,000 | $118,080 |
| 2017 | $2,866 | $122,800 | $17,000 | $105,800 |
| 2016 | $2,612 | $111,910 | $17,000 | $94,910 |
| 2015 | $489 | $94,490 | $17,000 | $77,490 |
| 2014 | $598 | $85,900 | $17,000 | $68,900 |
Source: Public Records
Map
Nearby Homes
- 4605 Greenwood Dr
- 1422 Township Ct
- 5201 Hampton Ct
- 5125 Cotter Ln
- 1415 Caslyn Dr
- 1806 Green Gate Dr
- 4901 E Columbary Dr
- 4801 E Columbary Dr
- 5121 Alderney Ct
- 1733 Brumbelow St
- 1606 Klauke St
- 1802 Junker St
- 1205 Moray Dr
- 4707 E Parma Dr
- 1815 Brumbelow St
- 1921 Ripple Creek Dr
- 2103 Briar Ridge Dr
- 4202 Junker St
- 1733 Jones St
- 2433 Freeway Manor Dr
- 4801 Redbud Dr
- 4733 Redbud Dr
- 4805 Redbud Dr
- 4729 Redbud Dr
- 4800 Dogwood Dr
- 4716 Dogwood Dr
- 4804 Dogwood Dr
- 4725 Redbud Dr
- 4809 Redbud Dr
- 4712 Dogwood Dr
- 4808 Dogwood Dr
- 4708 Dogwood Dr
- 4813 Redbud Dr
- 4736 Redbud Dr
- 4721 Redbud Dr
- 4732 Redbud Dr
- 4728 Redbud Dr
- 4800 Redbud Dr
- 4812 Dogwood Dr
- 4804 Redbud Dr
Your Personal Tour Guide
Ask me questions while you tour the home.