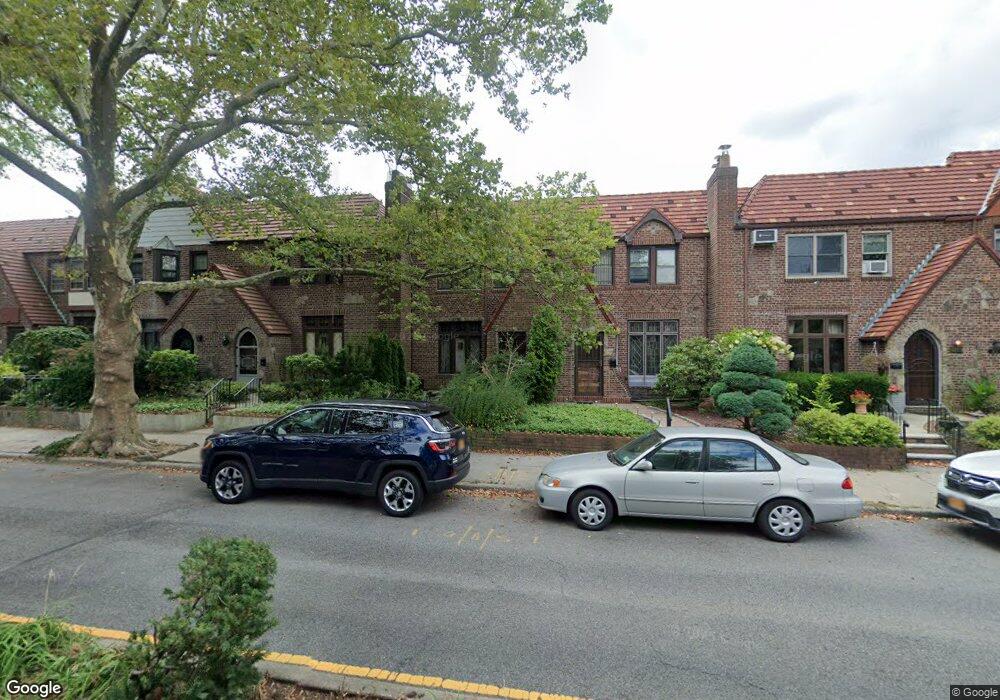
4738 188th St Flushing, NY 11358
Auburndale NeighborhoodEstimated Value: $906,000 - $946,000
--
Bed
--
Bath
1,560
Sq Ft
$596/Sq Ft
Est. Value
About This Home
This home is located at 4738 188th St, Flushing, NY 11358 and is currently estimated at $930,429, approximately $596 per square foot. 4738 188th St is a home located in Queens County with nearby schools including P.S. 162 The John Golden School, George J. Ryan Middle School 216, and Francis Lewis High School.
Ownership History
Date
Name
Owned For
Owner Type
Purchase Details
Closed on
Apr 28, 2025
Sold by
Zarbis Catherine and Zarbis Emmanuel
Bought by
4738 188Th St Llc
Current Estimated Value
Home Financials for this Owner
Home Financials are based on the most recent Mortgage that was taken out on this home.
Original Mortgage
$575,000
Outstanding Balance
$571,911
Interest Rate
6.62%
Mortgage Type
Purchase Money Mortgage
Estimated Equity
$358,518
Purchase Details
Closed on
Oct 20, 2017
Sold by
Zarbis Catherine
Bought by
Zarbis Catherine and Zarbis Emmanuel
Home Financials for this Owner
Home Financials are based on the most recent Mortgage that was taken out on this home.
Original Mortgage
$350,000
Interest Rate
3.83%
Mortgage Type
New Conventional
Purchase Details
Closed on
Feb 13, 2002
Sold by
Immello Loretta Guard and Mercer Joyce Guard
Bought by
Zabris Catherine
Home Financials for this Owner
Home Financials are based on the most recent Mortgage that was taken out on this home.
Original Mortgage
$248,000
Interest Rate
7.04%
Create a Home Valuation Report for This Property
The Home Valuation Report is an in-depth analysis detailing your home's value as well as a comparison with similar homes in the area
Home Values in the Area
Average Home Value in this Area
Purchase History
| Date | Buyer | Sale Price | Title Company |
|---|---|---|---|
| 4738 188Th St Llc | -- | -- | |
| 4738 188Th St Llc | -- | -- | |
| Zarbis Catherine | -- | -- | |
| Zarbis Catherine | -- | -- | |
| Zabris Catherine | -- | -- | |
| Zabris Catherine | -- | -- |
Source: Public Records
Mortgage History
| Date | Status | Borrower | Loan Amount |
|---|---|---|---|
| Open | 4738 188Th St Llc | $575,000 | |
| Closed | 4738 188Th St Llc | $575,000 | |
| Previous Owner | Zarbis Catherine | $350,000 | |
| Previous Owner | Zabris Catherine | $248,000 |
Source: Public Records
Tax History Compared to Growth
Tax History
| Year | Tax Paid | Tax Assessment Tax Assessment Total Assessment is a certain percentage of the fair market value that is determined by local assessors to be the total taxable value of land and additions on the property. | Land | Improvement |
|---|---|---|---|---|
| 2025 | $8,376 | $42,816 | $12,488 | $30,328 |
| 2024 | $8,376 | $41,705 | $11,431 | $30,274 |
| 2023 | $7,944 | $39,554 | $11,801 | $27,753 |
| 2022 | $7,467 | $52,320 | $16,380 | $35,940 |
| 2021 | $7,510 | $55,980 | $16,380 | $39,600 |
| 2020 | $7,552 | $54,960 | $16,380 | $38,580 |
| 2019 | $7,270 | $55,140 | $16,380 | $38,760 |
| 2018 | $6,719 | $32,962 | $11,014 | $21,948 |
| 2017 | $6,354 | $31,170 | $13,572 | $17,598 |
| 2016 | $5,945 | $31,170 | $13,572 | $17,598 |
| 2015 | $3,547 | $29,733 | $13,367 | $16,366 |
| 2014 | $3,547 | $28,962 | $14,773 | $14,189 |
Source: Public Records
Map
Nearby Homes
- 47-09 188th St
- 47-51 190th St
- 19005 48th Ave
- 4818 190th St
- 17446 Gladwin Ave
- 4620 190th St
- 173-16 Fairchild Ave
- 48-62 188th St
- 171-06 Bagley Ave
- 4826 193rd St
- 4953 Fresh Meadow Ln
- 47-69 195th St
- 50-43 192nd St
- 4539 192nd St
- 4604 195th St
- 45-47 193rd St
- 50-12 Utopia Pkwy
- 4919 169th St
- 5335 192nd St
- 4419 192nd St