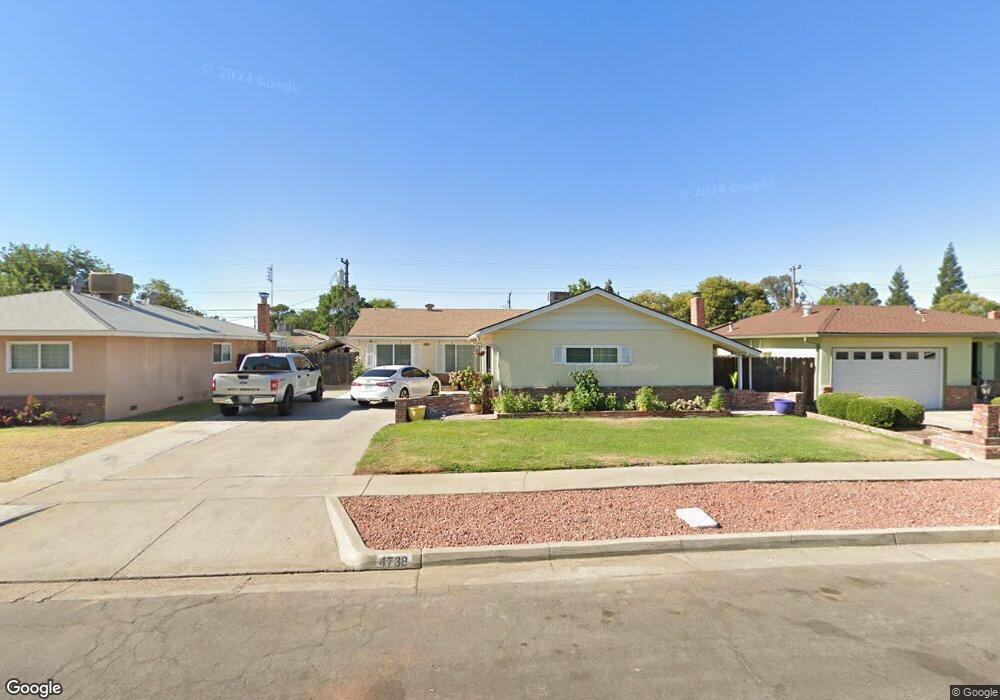
4738 E Ashcroft Ave Fresno, CA 93726
Hoover NeighborhoodEstimated Value: $292,000 - $366,000
2
Beds
2
Baths
1,304
Sq Ft
$256/Sq Ft
Est. Value
About This Home
This home is located at 4738 E Ashcroft Ave, Fresno, CA 93726 and is currently estimated at $334,018, approximately $256 per square foot. 4738 E Ashcroft Ave is a home located in Fresno County with nearby schools including Vinland Elementary School, Tioga Middle School, and Herbert Hoover High School.
Ownership History
Date
Name
Owned For
Owner Type
Purchase Details
Closed on
Dec 29, 2009
Sold by
Us Bank National Association Nd
Bought by
Koop Richard R and Koop Rose R
Current Estimated Value
Purchase Details
Closed on
Jun 10, 2009
Sold by
Cromer Aj and Cromer Sarah F
Bought by
Us Bank National Association Nd
Purchase Details
Closed on
Oct 3, 2000
Sold by
Shaghoian Paul A and Shaghoian Laura E
Bought by
Cromer A J and Cromer Sarah F
Home Financials for this Owner
Home Financials are based on the most recent Mortgage that was taken out on this home.
Original Mortgage
$80,833
Interest Rate
7.89%
Mortgage Type
FHA
Purchase Details
Closed on
Aug 15, 2000
Sold by
Reeves Samuel T and Reeves Elizabeth
Bought by
Fresno Pacific University
Home Financials for this Owner
Home Financials are based on the most recent Mortgage that was taken out on this home.
Original Mortgage
$80,833
Interest Rate
7.89%
Mortgage Type
FHA
Create a Home Valuation Report for This Property
The Home Valuation Report is an in-depth analysis detailing your home's value as well as a comparison with similar homes in the area
Home Values in the Area
Average Home Value in this Area
Purchase History
| Date | Buyer | Sale Price | Title Company |
|---|---|---|---|
| Koop Richard R | $85,000 | North American Title Company | |
| Us Bank National Association Nd | $82,463 | None Available | |
| Cromer A J | $78,000 | Fidelity National Title Co | |
| Fresno Pacific University | -- | Fidelity National Title Co |
Source: Public Records
Mortgage History
| Date | Status | Borrower | Loan Amount |
|---|---|---|---|
| Previous Owner | Cromer A J | $80,833 |
Source: Public Records
Tax History
| Year | Tax Paid | Tax Assessment Tax Assessment Total Assessment is a certain percentage of the fair market value that is determined by local assessors to be the total taxable value of land and additions on the property. | Land | Improvement |
|---|---|---|---|---|
| 2025 | $1,445 | $109,708 | $58,081 | $51,627 |
| 2023 | $1,364 | $105,450 | $55,827 | $49,623 |
| 2022 | $1,346 | $103,383 | $54,733 | $48,650 |
| 2021 | $1,309 | $101,357 | $53,660 | $47,697 |
| 2020 | $1,304 | $100,318 | $53,110 | $47,208 |
| 2019 | $1,255 | $98,352 | $52,069 | $46,283 |
| 2018 | $1,228 | $96,425 | $51,049 | $45,376 |
| 2017 | $1,207 | $94,536 | $50,049 | $44,487 |
| 2016 | $1,168 | $92,683 | $49,068 | $43,615 |
| 2015 | $1,150 | $91,291 | $48,331 | $42,960 |
| 2014 | $1,129 | $89,504 | $47,385 | $42,119 |
Source: Public Records
Map
Nearby Homes
- 4497 N Chestnut Ave
- 4421 N Woodrow Ave
- 4706 E San Gabriel Ave
- 4747 N Woodrow Ave Unit 140
- 4747 N Woodrow Ave Unit 120
- 4747 N Woodrow Ave Unit 122
- 4714 E Santa Ana Ave
- 2931 Paula Dr
- 4757 N Woodrow Ave Unit 141
- 4718 E Alamos Ave Unit 101
- 4676 E Alamos Ave Unit 106
- 4888 E Rialto Ave
- 4891 E Rialto Ave
- 916 W Holland Ave
- 4727 E Alamos Ave Unit 106
- 896 W Holland Ave
- 4875 N Backer Ave Unit 141
- 4875 N Backer Ave Unit 143
- 873 W Euclid Ave
- 4815 N Winery Cir
- 4742 E Ashcroft Ave
- 4732 E Ashcroft Ave
- 4737 E Holland Ave
- 4733 E Holland Ave
- 4743 E Holland Ave
- 4746 E Ashcroft Ave
- 4728 E Ashcroft Ave
- 4729 E Holland Ave
- 4747 E Holland Ave
- 4735 E Ashcroft Ave
- 4741 E Ashcroft Ave
- 4731 E Ashcroft Ave
- 4750 E Ashcroft Ave
- 4724 E Ashcroft Ave
- 4725 E Holland Ave
- 4727 E Ashcroft Ave
- 4751 E Holland Ave
- 4749 E Ashcroft Ave
- 4754 E Ashcroft Ave
- 4720 E Ashcroft Ave
Your Personal Tour Guide
Ask me questions while you tour the home.