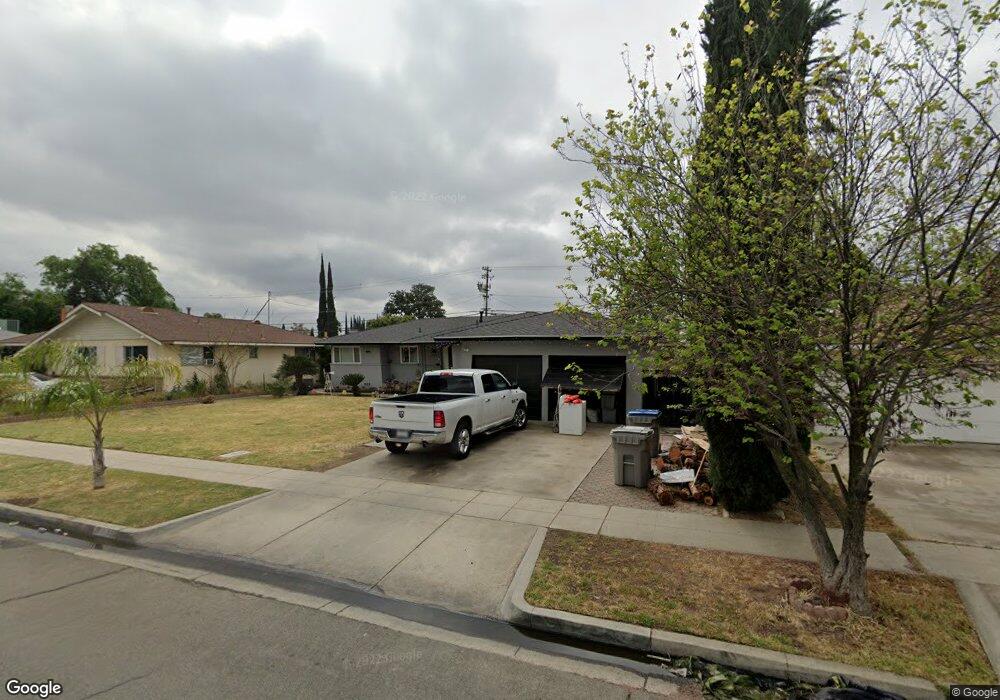
4738 E Terrace Ave Fresno, CA 93703
McLane NeighborhoodEstimated Value: $318,000 - $340,904
3
Beds
2
Baths
1,641
Sq Ft
$199/Sq Ft
Est. Value
About This Home
This home is located at 4738 E Terrace Ave, Fresno, CA 93703 and is currently estimated at $325,968, approximately $198 per square foot. 4738 E Terrace Ave is a home located in Fresno County with nearby schools including Ericson Elementary School, Scandinavian Middle School, and Mclane High School.
Ownership History
Date
Name
Owned For
Owner Type
Purchase Details
Closed on
May 4, 2009
Sold by
Fdic
Bought by
Almaraz Melissa
Current Estimated Value
Home Financials for this Owner
Home Financials are based on the most recent Mortgage that was taken out on this home.
Original Mortgage
$73,641
Interest Rate
4.87%
Mortgage Type
FHA
Purchase Details
Closed on
Jan 26, 2009
Sold by
Duch Samon and Duch Savann
Bought by
Indymac Federal Bank Fsb
Purchase Details
Closed on
May 22, 2001
Sold by
Simpson Dareld D and Simpson Judith A
Bought by
Duch Samon and Duch Savann
Home Financials for this Owner
Home Financials are based on the most recent Mortgage that was taken out on this home.
Original Mortgage
$87,624
Interest Rate
7.19%
Mortgage Type
FHA
Create a Home Valuation Report for This Property
The Home Valuation Report is an in-depth analysis detailing your home's value as well as a comparison with similar homes in the area
Home Values in the Area
Average Home Value in this Area
Purchase History
| Date | Buyer | Sale Price | Title Company |
|---|---|---|---|
| Almaraz Melissa | $75,000 | Commerce Title Company | |
| Almarez Melissa | -- | Commerce Title Company | |
| Indymac Federal Bank Fsb | $117,000 | None Available | |
| Duch Samon | $89,000 | First American Title Co |
Source: Public Records
Mortgage History
| Date | Status | Borrower | Loan Amount |
|---|---|---|---|
| Previous Owner | Almaraz Melissa | $73,641 | |
| Previous Owner | Duch Samon | $87,624 | |
| Closed | Duch Samon | $3,288 |
Source: Public Records
Tax History
| Year | Tax Paid | Tax Assessment Tax Assessment Total Assessment is a certain percentage of the fair market value that is determined by local assessors to be the total taxable value of land and additions on the property. | Land | Improvement |
|---|---|---|---|---|
| 2025 | $1,970 | $154,887 | $51,627 | $103,260 |
| 2023 | $1,859 | $148,874 | $49,623 | $99,251 |
| 2022 | $1,834 | $145,955 | $48,650 | $97,305 |
| 2021 | $1,783 | $143,095 | $47,697 | $95,398 |
| 2020 | $1,776 | $141,628 | $47,208 | $94,420 |
| 2019 | $1,707 | $138,852 | $46,283 | $92,569 |
| 2018 | $1,670 | $136,130 | $45,376 | $90,754 |
| 2017 | $1,642 | $133,462 | $44,487 | $88,975 |
| 2016 | $1,587 | $130,846 | $43,615 | $87,231 |
| 2015 | $1,563 | $128,881 | $42,960 | $85,921 |
| 2014 | $1,534 | $126,357 | $42,119 | $84,238 |
Source: Public Records
Map
Nearby Homes
- 4715 E Harvard Ave
- 4632 E Princeton Ave
- 2130 N Garden Ave
- 4774 E Simpson Ave
- 2146 N Maple Ave
- 4704 E Simpson Ave
- 4860 E Amherst Ave
- 2004 N Maple Ave
- 4597 E Cambridge Ave
- 2024 N Laureen Ave
- 2012 N Laureen Ave
- 4883 E Michigan Ave
- 4560 E Cambridge Ave
- 1745 N Winery Ave Unit 102
- 4873 E Pine Ave
- 4318 E Fairfax Ave
- 4137 E Cornell Ave
- 4774 E Hammond Ave
- 5097 E Carmen Ave
- 4531 E Hammond Ave
- 4742 E Terrace Ave
- 4732 E Terrace Ave
- 4748 E Terrace Ave
- 4728 E Terrace Ave
- 4737 E Clinton Ave
- 4743 E Clinton Ave
- 4733 E Clinton Ave
- 4735 E Terrace Ave
- 4731 E Terrace Ave
- 4741 E Terrace Ave
- 4727 E Clinton Ave
- 4722 E Terrace Ave
- 4754 E Terrace Ave
- 4725 E Terrace Ave
- 4745 E Terrace Ave
- 4723 E Clinton Ave
- 4753 E Clinton Ave
- 4721 E Terrace Ave
- 4718 E Terrace Ave
- 4757 E Terrace Ave
Your Personal Tour Guide
Ask me questions while you tour the home.