
Seller's Agent in 2025
Blake Keathley
EveryState
(602) 955-6606
16 in this area
513 Total Sales
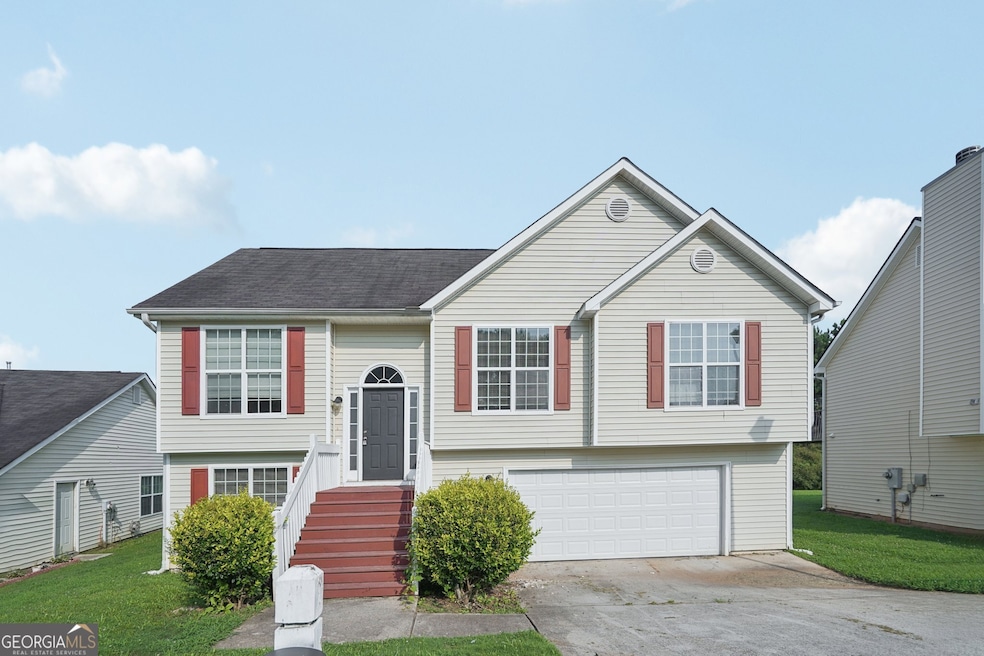
Possibilities abound for this Lithonia home! Step inside into the main level foyer and into the well-appointed living room, which features a fireplace. The kitchen boasts chic black appliances, hard surface countertops, and ample storage. Rounding out the main level is the primary suite and two secondary bedrooms. In the finished basement you'll find two additional secondary bedrooms and the home's laundry room. Schedule your showing and see for yourself the charm of this Riverbend Overlook home!
| Date | Type | Sale Price | Title Company |
|---|---|---|---|
| Warranty Deed | $260,000 | -- | |
| Quit Claim Deed | -- | -- | |
| Limited Warranty Deed | $3,454,944 | -- | |
| Limited Warranty Deed | -- | -- | |
| Foreclosure Deed | $77,000 | -- | |
| Quit Claim Deed | -- | -- | |
| Deed | $144,700 | -- |
| Date | Status | Loan Amount | Loan Type |
|---|---|---|---|
| Open | $10,000 | Unknown | |
| Open | $255,290 | FHA | |
| Previous Owner | $144,633 | New Conventional |
| Date | Event | Price | List to Sale | Price per Sq Ft |
|---|---|---|---|---|
| 11/07/2025 11/07/25 | Sold | $260,000 | 0.0% | $119 / Sq Ft |
| 09/04/2025 09/04/25 | Pending | -- | -- | -- |
| 09/03/2025 09/03/25 | Price Changed | $259,900 | -1.9% | $119 / Sq Ft |
| 07/31/2025 07/31/25 | Price Changed | $264,900 | -3.6% | $122 / Sq Ft |
| 07/28/2025 07/28/25 | Price Changed | $274,900 | -1.8% | $126 / Sq Ft |
| 07/18/2025 07/18/25 | Price Changed | $279,900 | -1.8% | $128 / Sq Ft |
| 07/10/2025 07/10/25 | Price Changed | $284,900 | -1.7% | $131 / Sq Ft |
| 06/26/2025 06/26/25 | For Sale | $289,900 | -- | $133 / Sq Ft |
| Year | Tax Paid | Tax Assessment Tax Assessment Total Assessment is a certain percentage of the fair market value that is determined by local assessors to be the total taxable value of land and additions on the property. | Land | Improvement |
|---|---|---|---|---|
| 2025 | $5,200 | $106,120 | $18,040 | $88,080 |
| 2024 | $5,167 | $106,120 | $18,040 | $88,080 |
| 2023 | $5,167 | $106,120 | $18,000 | $88,120 |
| 2022 | $4,300 | $89,960 | $10,000 | $79,960 |
| 2021 | $3,135 | $62,480 | $6,760 | $55,720 |
| 2020 | $2,402 | $46,529 | $6,138 | $40,391 |
| 2019 | $2,688 | $53,360 | $6,760 | $46,600 |
| 2018 | $1,722 | $46,529 | $6,138 | $40,391 |
| 2017 | $1,827 | $33,600 | $5,376 | $28,224 |
| 2016 | $1,831 | $33,600 | $5,376 | $28,224 |
| 2014 | $2,254 | $42,120 | $6,760 | $35,360 |
Seller's Agent in 2025
Blake Keathley
EveryState
(602) 955-6606
16 in this area
513 Total Sales
T
Buyer's Agent in 2025
Tonia Simmonsia
EasyStreet Realty Georgia
(770) 369-1877
6 in this area
30 Total Sales
Source: Georgia MLS
MLS Number: 10551992
APN: 11-230-02-069
Disclaimer: Certain information contained herein is derived from information provided by parties other than Homes.com. All information provided is deemed reliable, but is not guaranteed to be accurate and should be independently verified.
![]() The data relating to real estate for sale on this web site comes in part from the Broker Reciprocity Program of Georgia MLS. Real estate listings held by brokerage firms other than Redfin are marked with the Broker Reciprocity logo and detailed information about them includes the name of the listing brokers. Information deemed reliable but not guaranteed. Copyright 2025 Georgia MLS. All rights reserved.
The data relating to real estate for sale on this web site comes in part from the Broker Reciprocity Program of Georgia MLS. Real estate listings held by brokerage firms other than Redfin are marked with the Broker Reciprocity logo and detailed information about them includes the name of the listing brokers. Information deemed reliable but not guaranteed. Copyright 2025 Georgia MLS. All rights reserved.