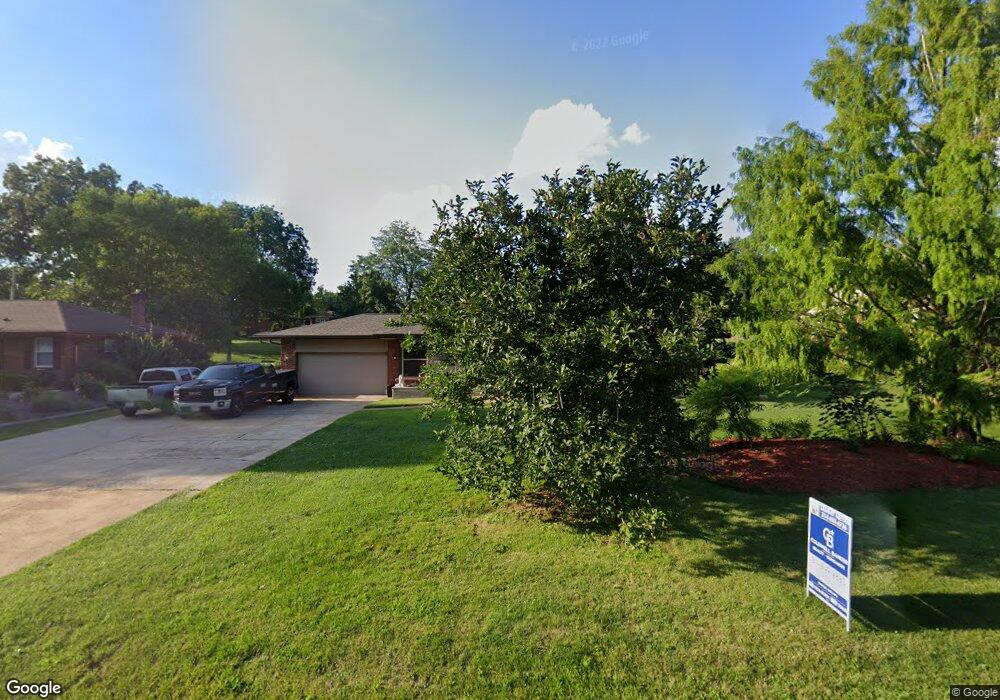
4739 E Concord Rd Saint Louis, MO 63128
Estimated Value: $386,000 - $418,000
4
Beds
2
Baths
1,772
Sq Ft
$225/Sq Ft
Est. Value
About This Home
This home is located at 4739 E Concord Rd, Saint Louis, MO 63128 and is currently estimated at $399,523, approximately $225 per square foot. 4739 E Concord Rd is a home located in St. Louis County with nearby schools including Sappington Elementary School, Sperreng Middle School, and Lindbergh High School.
Ownership History
Date
Name
Owned For
Owner Type
Purchase Details
Closed on
Nov 28, 2022
Sold by
Estes Kevin D and Estes Michele R
Bought by
Rooney Kevin and Rooney Sarah
Current Estimated Value
Home Financials for this Owner
Home Financials are based on the most recent Mortgage that was taken out on this home.
Original Mortgage
$287,920
Outstanding Balance
$277,787
Interest Rate
6.25%
Mortgage Type
New Conventional
Estimated Equity
$121,736
Purchase Details
Closed on
Aug 8, 2002
Sold by
Jon E Fuhrer Company
Bought by
Estes Kevin D and Estes Michele R
Home Financials for this Owner
Home Financials are based on the most recent Mortgage that was taken out on this home.
Original Mortgage
$139,175
Interest Rate
6.6%
Purchase Details
Closed on
Jun 14, 2002
Sold by
Ganz Barbara Ann
Bought by
Jon E Fuhrer Company
Home Financials for this Owner
Home Financials are based on the most recent Mortgage that was taken out on this home.
Original Mortgage
$139,175
Interest Rate
6.6%
Purchase Details
Closed on
Feb 28, 2002
Sold by
Pape Hildegard M
Bought by
Ganz Barbara Ann
Create a Home Valuation Report for This Property
The Home Valuation Report is an in-depth analysis detailing your home's value as well as a comparison with similar homes in the area
Home Values in the Area
Average Home Value in this Area
Purchase History
| Date | Buyer | Sale Price | Title Company |
|---|---|---|---|
| Rooney Kevin | -- | Investors Title | |
| Estes Kevin D | $154,640 | -- | |
| Jon E Fuhrer Company | $130,000 | -- | |
| Ganz Barbara Ann | -- | -- |
Source: Public Records
Mortgage History
| Date | Status | Borrower | Loan Amount |
|---|---|---|---|
| Open | Rooney Kevin | $287,920 | |
| Previous Owner | Estes Kevin D | $139,175 |
Source: Public Records
Tax History
| Year | Tax Paid | Tax Assessment Tax Assessment Total Assessment is a certain percentage of the fair market value that is determined by local assessors to be the total taxable value of land and additions on the property. | Land | Improvement |
|---|---|---|---|---|
| 2025 | $3,786 | $61,550 | $23,090 | $38,460 |
| 2024 | $3,786 | $58,180 | $21,170 | $37,010 |
| 2023 | $3,777 | $58,180 | $21,170 | $37,010 |
| 2022 | $3,286 | $48,530 | $19,250 | $29,280 |
| 2021 | $3,169 | $48,530 | $19,250 | $29,280 |
| 2020 | $2,722 | $40,160 | $16,070 | $24,090 |
| 2019 | $2,715 | $40,160 | $16,070 | $24,090 |
| 2018 | $2,343 | $31,470 | $9,940 | $21,530 |
| 2017 | $2,318 | $31,470 | $9,940 | $21,530 |
| 2016 | $2,187 | $28,180 | $9,940 | $18,240 |
Source: Public Records
Map
Nearby Homes
- 5019 Valley Crest Ct
- 11345 Revere Ln
- 4829 Gatesbury Dr
- 4931 Theiss Rd
- 4515 von Talge Meadows Ct
- 11143 Yuma Place
- 12055 Charwick Dr
- 4930 Mount Royal Rd
- 11214 Behr Dr
- 11542 Concord Village Ave
- 4501 Eli Dr Unit K
- 4501 Eli Dr Unit I
- 10005 Sakura Dr Unit D
- 11951 Tesson Ferry Rd Unit D
- 6910 Colonial Woods Dr Unit 95
- 10041 Sakura Dr
- 4525 Eli Dr Unit F
- 4525 Eli Dr Unit D
- 4523 Little Rock Rd Unit D
- 10809 Platte Dr
- 4745 E Concord Rd
- 4735 E Concord Rd
- 4749 E Concord Rd
- 11 Dorclin Ln
- 4729 E Concord Rd
- 4738 E Concord Rd
- 15 Dorclin Ln
- 27 Fawnwood Dr
- 4734 E Concord Rd
- 9 Dorclin Ln
- 1 Dorclin Ln
- 4723 E Concord Rd
- 4169 Concord Oaks Dr
- 4163 Concord Oaks Dr
- 4726 E Concord Rd
- 3 Dorclin Ln
- 26 Fawnwood Dr
- 17 Dorclin Ln
- 4157 Concord Oaks Dr
- 4720 E Concord Rd
Your Personal Tour Guide
Ask me questions while you tour the home.