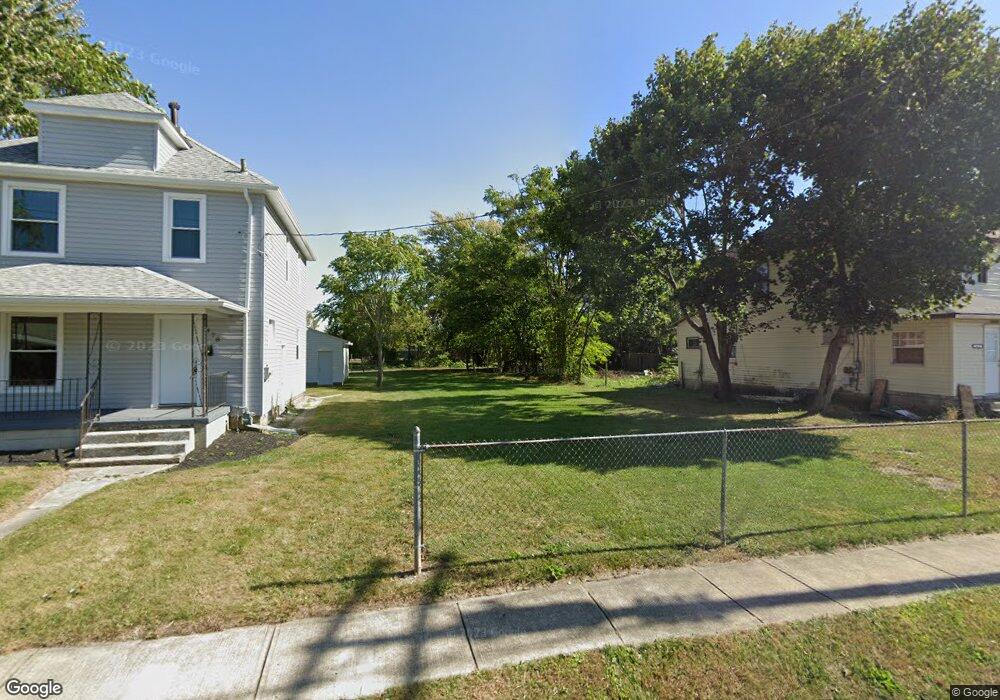
474 Avondale Ave Marion, OH 43302
Estimated Value: $77,000 - $121,000
2
Beds
1
Bath
572
Sq Ft
$172/Sq Ft
Est. Value
About This Home
This home is located at 474 Avondale Ave, Marion, OH 43302 and is currently estimated at $98,333, approximately $171 per square foot. 474 Avondale Ave is a home located in Marion County with nearby schools including Rutherford B. Hayes Elementary School, Ulysses S. Grant Middle School, and Harding High School.
Ownership History
Date
Name
Owned For
Owner Type
Purchase Details
Closed on
Nov 15, 2023
Sold by
Progressive Holdings Llc-
Bought by
Neal Gabriella Lynn
Current Estimated Value
Home Financials for this Owner
Home Financials are based on the most recent Mortgage that was taken out on this home.
Original Mortgage
$3,312
Outstanding Balance
$3,258
Interest Rate
7.57%
Estimated Equity
$95,075
Purchase Details
Closed on
Dec 9, 2021
Sold by
Marion Cnty Land Reutlization Corporaiti
Bought by
Hennessy Homes Ltd
Purchase Details
Closed on
Mar 7, 2017
Sold by
State Of Ohio
Bought by
Marion County Land Reutilization Corpora
Purchase Details
Closed on
Feb 24, 2017
Bought by
Ohio State Of
Purchase Details
Closed on
May 29, 1998
Bought by
Horn Tommy and Horn Angie
Purchase Details
Closed on
Dec 20, 1994
Bought by
Horn Tommy and Horn Angie
Create a Home Valuation Report for This Property
The Home Valuation Report is an in-depth analysis detailing your home's value as well as a comparison with similar homes in the area
Home Values in the Area
Average Home Value in this Area
Purchase History
| Date | Buyer | Sale Price | Title Company |
|---|---|---|---|
| Neal Gabriella Lynn | $132,500 | None Listed On Document | |
| Hennessy Homes Ltd | -- | None Available | |
| Marion County Land Reutilization Corpora | -- | Attorney | |
| Ohio State Of | -- | -- | |
| Horn Tommy | $35,000 | -- | |
| Horn Tommy | $12,000 | -- |
Source: Public Records
Mortgage History
| Date | Status | Borrower | Loan Amount |
|---|---|---|---|
| Open | Neal Gabriella Lynn | $3,312 | |
| Open | Neal Gabriella Lynn | $130,087 |
Source: Public Records
Tax History Compared to Growth
Tax History
| Year | Tax Paid | Tax Assessment Tax Assessment Total Assessment is a certain percentage of the fair market value that is determined by local assessors to be the total taxable value of land and additions on the property. | Land | Improvement |
|---|---|---|---|---|
| 2024 | $55 | $1,370 | $1,370 | $0 |
| 2023 | $55 | $1,190 | $1,190 | $0 |
| 2022 | $442 | $1,190 | $1,190 | $0 |
| 2021 | $442 | $1,190 | $1,190 | $0 |
| 2020 | $442 | $1,190 | $1,190 | $0 |
| 2019 | $442 | $1,190 | $1,190 | $0 |
| 2018 | $0 | $1,110 | $1,110 | $0 |
| 2017 | $0 | $11,010 | $1,110 | $9,900 |
| 2016 | $442 | $11,060 | $1,160 | $9,900 |
| 2015 | $442 | $10,820 | $1,110 | $9,710 |
| 2014 | $443 | $10,820 | $1,110 | $9,710 |
| 2012 | $495 | $12,030 | $1,180 | $10,850 |
Source: Public Records
Map
Nearby Homes
- 468 Avondale Ave
- 485 Avondale Ave
- 520 Toledo Ave
- 531 Toledo Ave
- 641 Blake Ave
- 523 Thompson St
- 551 Universal Ave Unit 555
- 355 Lee St
- 343 Commercial St
- 347 Mary St
- 178 Leader St
- 636 Mary St
- 233 Tully St
- 552 N Prospect St
- 134 Waterloo St
- 395 N Main St
- 213 Sharp St
- 325 Holmes Place
- 593 N State St
- 736 N Main St
- 478 Avondale Ave
- 484 Avondale Ave
- 462 Avondale Ave
- 473 Avondale Ave(p)
- 456 Avondale Ave
- 490 Avondale Ave
- 473 Avondale Ave
- 450 Avondale Ave
- 463 Avondale Ave
- 446 Avondale Ave
- 498 Avondale Ave
- 502 Avondale Ave
- 449 Bartram Ave
- 495 Avondale Ave
- 440 Avondale Ave
- 440 Avondale Ave
- 451 Avondale Ave
- 506 Avondale Ave
- 447 Bartram Ave
- 503 Avondale Ave