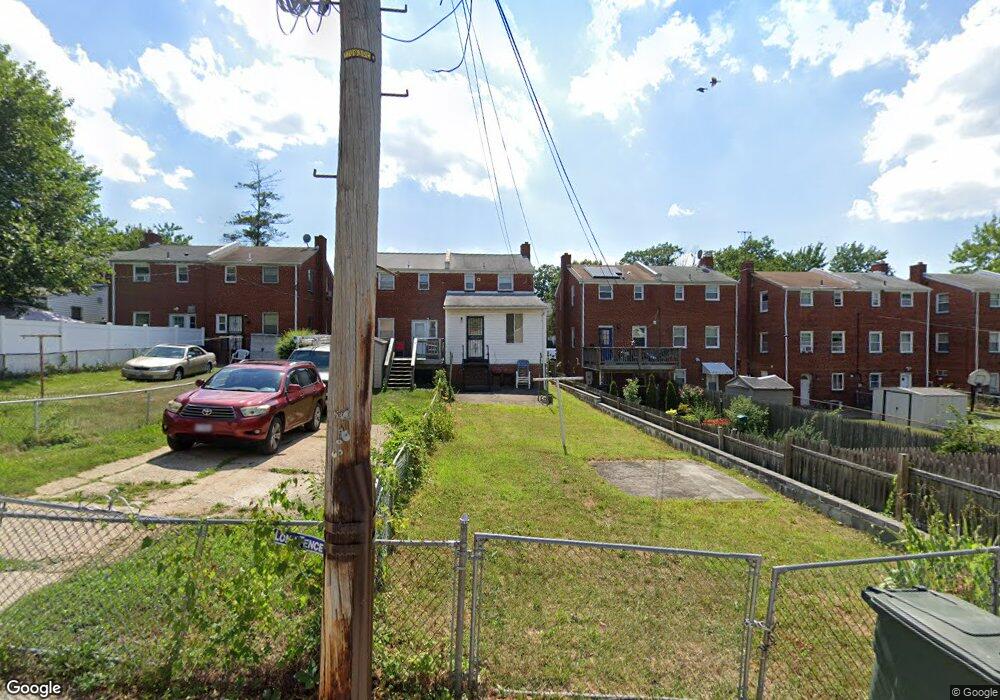
474 Burbank St SE Washington, DC 20019
Benning Ridge NeighborhoodEstimated Value: $337,887 - $424,000
2
Beds
1
Bath
1,190
Sq Ft
$314/Sq Ft
Est. Value
About This Home
This home is located at 474 Burbank St SE, Washington, DC 20019 and is currently estimated at $373,722, approximately $314 per square foot. 474 Burbank St SE is a home located in District of Columbia with nearby schools including Plummer Elementary School, Sousa Middle School, and Anacostia High School.
Ownership History
Date
Name
Owned For
Owner Type
Purchase Details
Closed on
Mar 10, 2025
Sold by
Mcpherson Olive Ann
Bought by
Mcpherson Olive Ann and Sloley Jamar Charles
Current Estimated Value
Purchase Details
Closed on
Nov 8, 2004
Sold by
Jackson Yvonne J
Bought by
Vincent Latrice A
Home Financials for this Owner
Home Financials are based on the most recent Mortgage that was taken out on this home.
Original Mortgage
$36,300
Interest Rate
5.8%
Mortgage Type
Construction
Purchase Details
Closed on
Mar 30, 2001
Sold by
Coleman Curlene R
Bought by
Jackson Yvonne J
Home Financials for this Owner
Home Financials are based on the most recent Mortgage that was taken out on this home.
Original Mortgage
$104,500
Interest Rate
7.05%
Create a Home Valuation Report for This Property
The Home Valuation Report is an in-depth analysis detailing your home's value as well as a comparison with similar homes in the area
Home Values in the Area
Average Home Value in this Area
Purchase History
| Date | Buyer | Sale Price | Title Company |
|---|---|---|---|
| Mcpherson Olive Ann | -- | None Listed On Document | |
| Vincent Latrice A | $181,500 | -- | |
| Jackson Yvonne J | $110,000 | -- |
Source: Public Records
Mortgage History
| Date | Status | Borrower | Loan Amount |
|---|---|---|---|
| Previous Owner | Vincent Latrice A | $36,300 | |
| Previous Owner | Jackson Yvonne J | $104,500 |
Source: Public Records
Tax History Compared to Growth
Tax History
| Year | Tax Paid | Tax Assessment Tax Assessment Total Assessment is a certain percentage of the fair market value that is determined by local assessors to be the total taxable value of land and additions on the property. | Land | Improvement |
|---|---|---|---|---|
| 2025 | $2,294 | $359,740 | $144,890 | $214,850 |
| 2024 | $2,123 | $353,780 | $142,680 | $211,100 |
| 2023 | $1,954 | $346,790 | $139,980 | $206,810 |
| 2022 | $1,817 | $323,520 | $137,690 | $185,830 |
| 2021 | $1,670 | $297,720 | $131,390 | $166,330 |
| 2020 | $1,523 | $279,040 | $126,940 | $152,100 |
| 2019 | $1,391 | $267,290 | $122,470 | $144,820 |
| 2018 | $1,277 | $250,780 | $0 | $0 |
| 2017 | $1,167 | $221,540 | $0 | $0 |
| 2016 | $1,067 | $200,020 | $0 | $0 |
| 2015 | $972 | $190,630 | $0 | $0 |
| 2014 | $894 | $175,400 | $0 | $0 |
Source: Public Records
Map
Nearby Homes
- 4343 F St SE
- 4348 D St SE
- 709 Adrian St SE
- 4244 Hildreth St SE
- 310 Cape Dr SE
- 4329 H St SE
- 4473 B St SE Unit T1
- 1112 Chaplin St SE
- 4619 G St SE
- 4441 A St SE
- 4724 Benning Rd SE Unit 202
- 4138 E Capitol St NE
- 4620 Hanna Place SE
- 1121 45th Place SE
- 4800 C St SE Unit 102
- 4270 E Capitol St NE Unit 104
- 4270 E Capitol St NE Unit 301
- 3910 Burns Ct SE
- 4650 Hanna Place SE
- 4272 E Capitol St NE Unit 2
- 470 Burbank St SE
- 476 Burbank St SE
- 468 Burbank St SE
- 480 Burbank St SE
- 464 Burbank St SE
- 482 Burbank St SE
- 462 Burbank St SE
- 486 Burbank St SE
- 458 Burbank St SE
- 4350 Texas Ave SE
- 488 Burbank St SE
- 456 Burbank St SE
- 4342 Texas Ave SE
- 4344 Texas Ave SE
- 446 Burbank St SE
- 4338 Texas Ave SE
- 4355 Texas Ave SE
- 4336 Texas Ave SE
- 441-453 Chaplin St SE
- 445 Burbank St SE