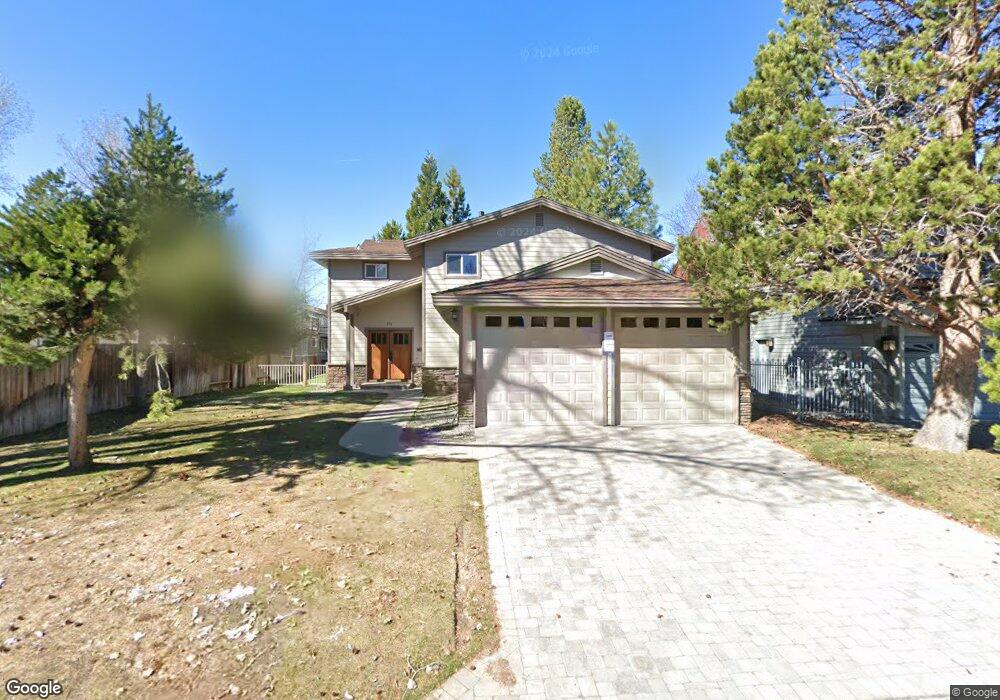
474 Capri Dr South Lake Tahoe, CA 96150
Estimated Value: $1,302,000 - $1,796,650
4
Beds
3
Baths
2,872
Sq Ft
$561/Sq Ft
Est. Value
About This Home
This home is located at 474 Capri Dr, South Lake Tahoe, CA 96150 and is currently estimated at $1,610,913, approximately $560 per square foot. 474 Capri Dr is a home located in El Dorado County with nearby schools including Tahoe Valley Elementary School, South Tahoe Middle School, and South Tahoe High School.
Ownership History
Date
Name
Owned For
Owner Type
Purchase Details
Closed on
May 9, 2017
Sold by
Sturtz Donald E and Sturtz Joan T
Bought by
Sturtz Donald E and Sturtz Joan T
Current Estimated Value
Purchase Details
Closed on
Mar 7, 2014
Sold by
Kaefer Brian A and Kaefer Kristen S
Bought by
Kaefer Revocable Trust
Purchase Details
Closed on
Oct 17, 2012
Sold by
Bertsch Ryan M and Bertsch Karrie S
Bought by
Bertsch Ryan Matthew and Bertsch Karrie Sturtz
Purchase Details
Closed on
Oct 5, 2012
Sold by
Sturtz Donald E and Sturtz Joan T
Bought by
Sturtz Donald E and Sturtz Joan T
Purchase Details
Closed on
Jun 14, 2007
Sold by
Sakauye Marie
Bought by
Sturtz Donald E and Sturtz Joan T
Home Financials for this Owner
Home Financials are based on the most recent Mortgage that was taken out on this home.
Original Mortgage
$415,000
Interest Rate
6.16%
Mortgage Type
Purchase Money Mortgage
Purchase Details
Closed on
Jul 12, 1995
Sold by
Sakauye Eiichi E and Sakauye Marie T
Bought by
Sakauye Eiichi and Sakauye Marie
Create a Home Valuation Report for This Property
The Home Valuation Report is an in-depth analysis detailing your home's value as well as a comparison with similar homes in the area
Home Values in the Area
Average Home Value in this Area
Purchase History
| Date | Buyer | Sale Price | Title Company |
|---|---|---|---|
| Sturtz Donald E | -- | None Available | |
| Kaefer Revocable Trust | -- | None Available | |
| Bertsch Ryan Matthew | -- | None Available | |
| Sturtz Donald E | $70,000 | None Available | |
| Sturtz Donald E | $825,000 | Stewart Title Company | |
| Sakauye Eiichi | -- | -- |
Source: Public Records
Mortgage History
| Date | Status | Borrower | Loan Amount |
|---|---|---|---|
| Previous Owner | Sturtz Donald E | $415,000 |
Source: Public Records
Tax History Compared to Growth
Tax History
| Year | Tax Paid | Tax Assessment Tax Assessment Total Assessment is a certain percentage of the fair market value that is determined by local assessors to be the total taxable value of land and additions on the property. | Land | Improvement |
|---|---|---|---|---|
| 2025 | $11,878 | $1,135,512 | $669,881 | $465,631 |
| 2024 | $11,878 | $1,113,248 | $656,747 | $456,501 |
| 2023 | $11,670 | $1,091,420 | $643,870 | $447,550 |
| 2022 | $11,555 | $1,070,021 | $631,246 | $438,775 |
| 2021 | $11,436 | $1,054,671 | $618,869 | $435,802 |
| 2020 | $11,333 | $1,049,786 | $612,524 | $437,262 |
| 2019 | $11,280 | $1,029,428 | $600,514 | $428,914 |
| 2018 | $11,029 | $1,009,470 | $588,740 | $420,730 |
| 2017 | $10,211 | $930,500 | $542,000 | $388,500 |
| 2016 | $9,576 | $873,000 | $508,000 | $365,000 |
| 2015 | $8,149 | $738,500 | $429,000 | $309,500 |
| 2014 | $7,848 | $727,000 | $335,655 | $391,345 |
Source: Public Records
Map
Nearby Homes
- 489 Tahoe Keys Blvd Unit 68
- 489 Tahoe Keys Blvd Unit 47
- 489 Tahoe Keys Blvd Unit 55
- 489 Tahoe Keys Blvd Unit 56
- 439 Ala Wai Blvd Unit 106
- 439 Ala Wai Blvd Unit 111
- 439 Ala Wai Blvd Unit 140
- 497 Tahoe Keys Blvd Unit 20
- 477 Ala Wai Blvd Unit 91
- 555 Tahoe Keys Blvd Unit 13
- 2185 Morro Dr
- 276 Beach Dr
- 569 Lucerne Way
- 2081 Venice Dr Unit 285
- 2081 Venice Dr Unit 280
- 2244 Texas Ave
- 2030 Aloha Dr
- 552 Christie Dr Unit 307
- 2031 Venice Dr Unit 322
- 783 Michael Ct Unit Share B
- 470 Capri Dr
- 2255 Inverness Dr
- 2249 Inverness Dr
- 464 Capri Dr
- 2243 Inverness Dr
- 475 Capri Dr
- 479 Capri Dr
- 467 Capri Dr
- 2254 Catalina Dr
- 2248 Catalina Dr
- 2239 Inverness Dr
- 483 Capri Dr
- 463 Capri Dr
- 492 Capri Dr
- 2240 Catalina Dr
- 487 Capri Dr
- 2244 Inverness Dr
- 2233 Inverness Dr
- 2240 Inverness Dr
- 2236 Catalina Dr