474 Cross St Boylston, MA 01505
Estimated Value: $840,000 - $1,265,000
About This Home
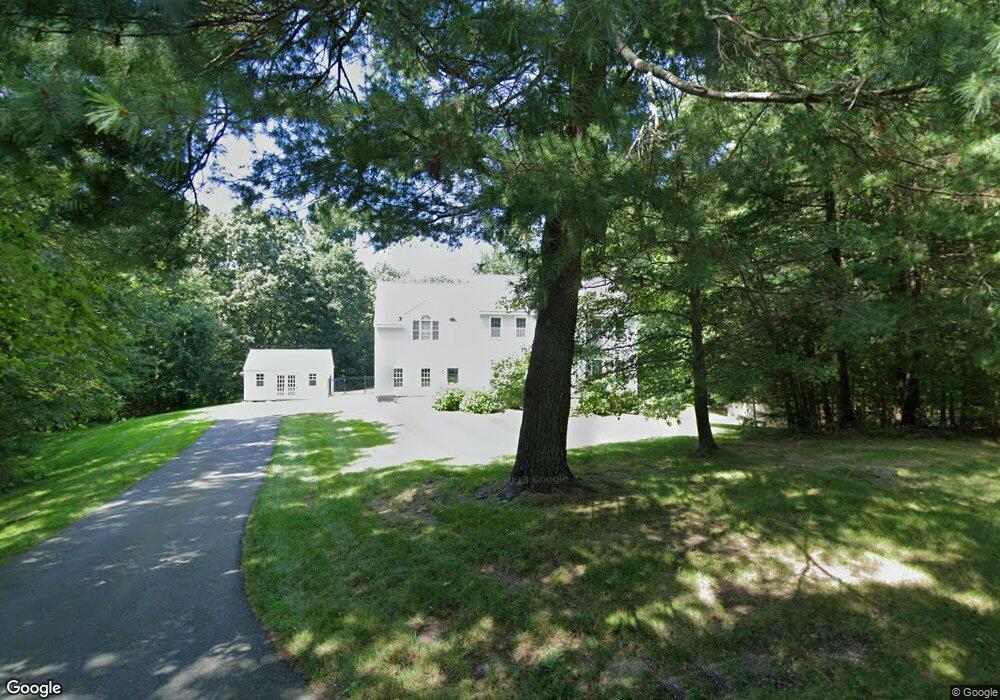
This home is located at 474 Cross St, Boylston, MA 01505 and is currently estimated at $984,928, approximately $323 per square foot. 474 Cross St is a home located in Worcester County with nearby schools including Tahanto Regional High School.
Ownership History
We collect this data history from publicly available records. To have your information removed, we recommend requesting removal directly through your county’s website.
Purchase Details
Home Financials for this Owner
Home Financials are based on the most recent Mortgage that was taken out on this home.Purchase Details
Purchase Details
Purchase Details
Home Values in the Area
Average Home Value in this Area
Purchase History
We collect this data history from publicly available records. To have your information removed, we recommend requesting removal directly through your county’s website.
| Date | Buyer | Sale Price | Title Company |
|---|---|---|---|
| $502,500 | -- | ||
| $260,000 | -- | ||
| $80,000 | -- | ||
| $175,000 | -- |
Mortgage History
We collect this data history from publicly available records. To have your information removed, we recommend requesting removal directly through your county’s website.
| Date | Status | Borrower | Loan Amount |
|---|---|---|---|
| Open | $402,000 | ||
| Previous Owner | $390,400 | ||
| Previous Owner | $272,640 |
Tax History
We collect this data history from publicly available records. To have your information removed, we recommend requesting removal directly through your county’s website.
| Year | Tax Paid | Tax Assessment Tax Assessment Total Assessment is a certain percentage of the fair market value that is determined by local assessors to be the total taxable value of land and additions on the property. | Land | Improvement |
|---|---|---|---|---|
| 2025 | $10,307 | $745,300 | $197,800 | $547,500 |
| 2024 | $9,280 | $672,000 | $197,800 | $474,200 |
| 2023 | $9,386 | $651,800 | $197,800 | $454,000 |
| 2022 | $8,886 | $561,000 | $197,800 | $363,200 |
| 2021 | $9,307 | $548,100 | $197,800 | $350,300 |
| 2020 | $8,811 | $532,700 | $200,200 | $332,500 |
| 2019 | $8,251 | $514,400 | $198,200 | $316,200 |
| 2018 | $8,372 | $500,400 | $198,200 | $302,200 |
| 2017 | $8,066 | $500,400 | $198,200 | $302,200 |
| 2016 | $7,312 | $446,700 | $158,600 | $288,100 |
| 2015 | $7,777 | $446,700 | $158,600 | $288,100 |
| 2014 | $7,316 | $420,700 | $145,400 | $275,300 |
Map
- 9 Bay Path Dr
- 93 Stiles Rd
- 5 Redwood Cir
- 23 Twin Spring Dr
- 173 Central St
- 101 Green St
- 1 Perry Rd
- Lot 52A Barnard Hill Rd
- 52 Barnard Hill Rd
- 49 Barnard Hill Rd
- 225 E Temple St
- 400 School St
- 904 Edgebrook Dr
- 7 Burkhardt Cir Unit 10
- 322 Edgebrook Dr Unit 322
- 14 Colonial Dr
- 211 Sewall St
- 34 Joseph Rd
- 8 Deerfield Rd
- 33 Smallwood Cir
Ask me questions while you tour the home.