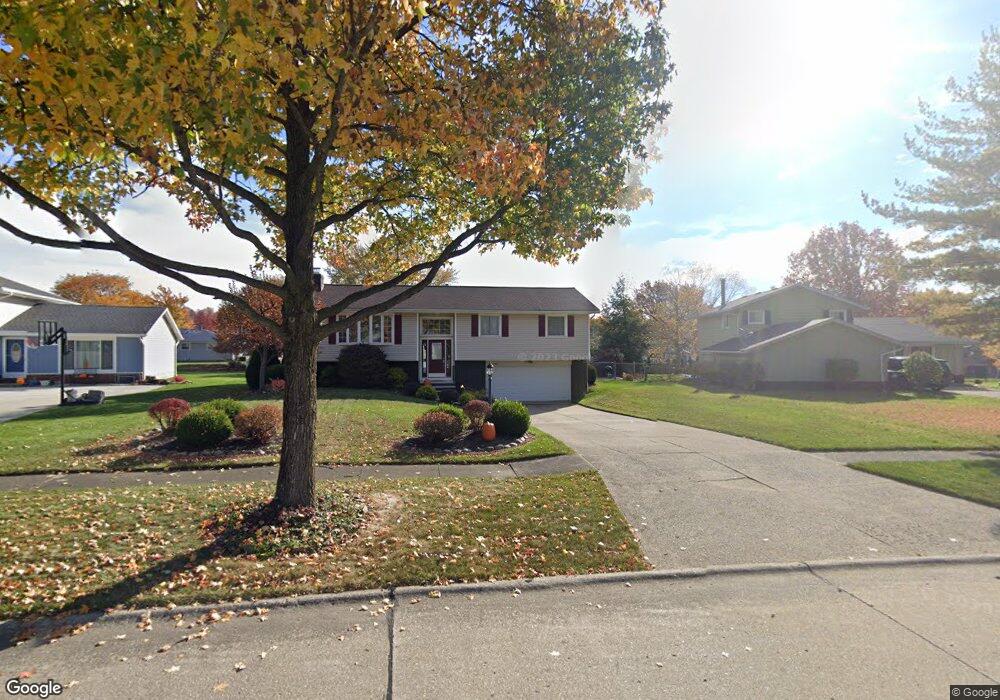
4740 Locust Ln Brunswick, OH 44212
Estimated Value: $284,021 - $327,000
3
Beds
2
Baths
1,284
Sq Ft
$237/Sq Ft
Est. Value
About This Home
This home is located at 4740 Locust Ln, Brunswick, OH 44212 and is currently estimated at $303,755, approximately $236 per square foot. 4740 Locust Ln is a home located in Medina County with nearby schools including Hickory Ridge Elementary School, Willets Middle School, and Brunswick High School.
Ownership History
Date
Name
Owned For
Owner Type
Purchase Details
Closed on
Mar 6, 2013
Sold by
Wessner Stacey L
Bought by
Wessner Chad J
Current Estimated Value
Purchase Details
Closed on
Jan 29, 2013
Sold by
Wessner Chad J
Bought by
Wessner Stacey L
Purchase Details
Closed on
Nov 21, 2001
Sold by
Larry Crissinger
Bought by
Wessner Chad J and Wessner Stacey L
Home Financials for this Owner
Home Financials are based on the most recent Mortgage that was taken out on this home.
Original Mortgage
$137,700
Outstanding Balance
$53,423
Interest Rate
6.62%
Estimated Equity
$250,332
Purchase Details
Closed on
Sep 3, 1996
Sold by
Sejd Gregory J
Bought by
Crissinger Larry and Longstreet Dana
Home Financials for this Owner
Home Financials are based on the most recent Mortgage that was taken out on this home.
Original Mortgage
$117,800
Interest Rate
7.38%
Mortgage Type
New Conventional
Create a Home Valuation Report for This Property
The Home Valuation Report is an in-depth analysis detailing your home's value as well as a comparison with similar homes in the area
Home Values in the Area
Average Home Value in this Area
Purchase History
| Date | Buyer | Sale Price | Title Company |
|---|---|---|---|
| Wessner Chad J | -- | None Available | |
| Wessner Stacey L | -- | None Available | |
| Wessner Chad J | $153,000 | Insignia Title Agency Ltd | |
| Crissinger Larry | $124,000 | -- |
Source: Public Records
Mortgage History
| Date | Status | Borrower | Loan Amount |
|---|---|---|---|
| Open | Wessner Chad J | $137,700 | |
| Closed | Crissinger Larry | $117,800 |
Source: Public Records
Tax History Compared to Growth
Tax History
| Year | Tax Paid | Tax Assessment Tax Assessment Total Assessment is a certain percentage of the fair market value that is determined by local assessors to be the total taxable value of land and additions on the property. | Land | Improvement |
|---|---|---|---|---|
| 2024 | $3,573 | $72,260 | $24,260 | $48,000 |
| 2023 | $3,573 | $72,260 | $24,260 | $48,000 |
| 2022 | $3,380 | $72,260 | $24,260 | $48,000 |
| 2021 | $2,992 | $57,350 | $19,250 | $38,100 |
| 2020 | $2,692 | $57,350 | $19,250 | $38,100 |
| 2019 | $2,693 | $57,350 | $19,250 | $38,100 |
| 2018 | $2,482 | $50,130 | $16,700 | $33,430 |
| 2017 | $2,485 | $50,130 | $16,700 | $33,430 |
| 2016 | $2,483 | $50,130 | $16,700 | $33,430 |
| 2015 | $2,333 | $45,570 | $15,180 | $30,390 |
| 2014 | $2,325 | $45,570 | $15,180 | $30,390 |
| 2013 | $2,274 | $45,570 | $15,180 | $30,390 |
Source: Public Records
Map
Nearby Homes
- 786 Pepperwood Dr
- 833 Substation Rd
- 841 Substation Rd
- 892 Crabapple Dr
- 4647 Boxwood Dr
- 4723 Baywood Dr
- 4910 Fallen Leaf Trail
- 4913 Fallen Leaf Trail
- 4597 Brushwood Cir
- 4928 Treeline Dr
- 4684 Wolff Dr
- 660 Marsh Way
- 5046 Forestland Ct
- 4949 Orchard Dr
- 1151 Mulberry Ln
- 642 Topaz Ln
- 4893 Grafton Rd
- 1202 Substation Rd
- 573 Oakhurst Dr
- 4340 Oak Ridge Trail
- 4738 Locust Ln
- 4742 Locust Ln
- 4703 Cottonwood Ln
- 4744 Locust Ln
- 4699 Cottonwood Ln
- 4707 Cottonwood Ln
- 4695 Cottonwood Ln
- 4736 Persimmon Ln
- 4728 Persimmon Ln
- 4751 Locust Ln
- 4711 Cottonwood Ln
- 4720 Persimmon Ln
- 4755 Locust Ln
- 4748 Locust Ln
- 4752 Persimmon Ln
- 4719 Cottonwood Ln
- 4712 Persimmon Ln
- 4765 Locust Ln
- 4729 Cottonwood Ln
- 4756 Locust Ln