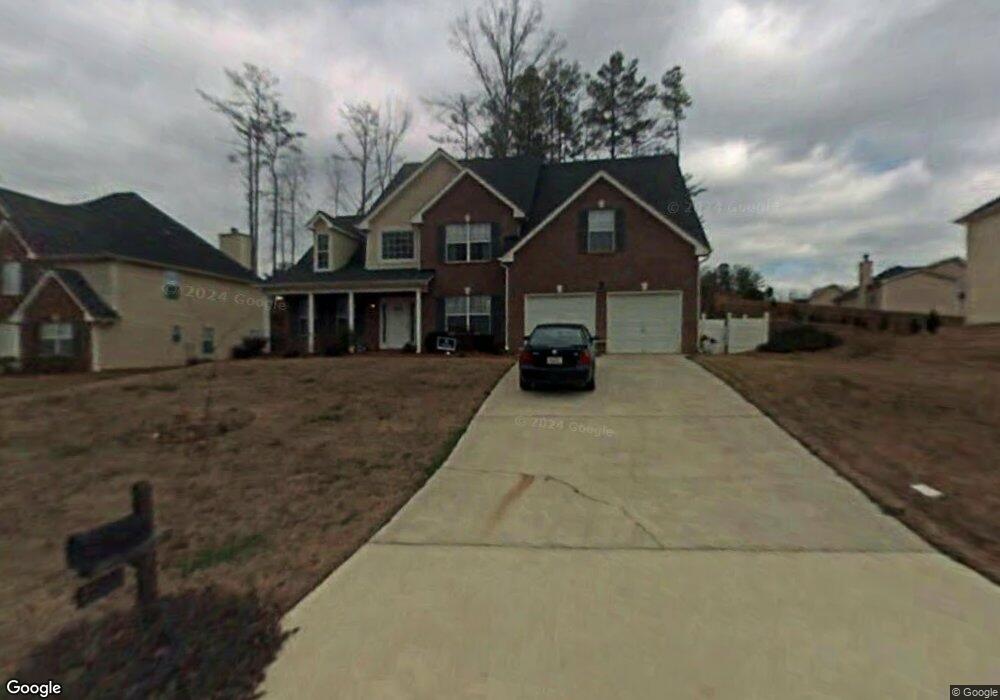
4740 Ruby Forrest Dr Stone Mountain, GA 30083
Estimated Value: $343,000 - $373,000
4
Beds
4
Baths
3,147
Sq Ft
$113/Sq Ft
Est. Value
About This Home
This home is located at 4740 Ruby Forrest Dr, Stone Mountain, GA 30083 and is currently estimated at $357,093, approximately $113 per square foot. 4740 Ruby Forrest Dr is a home located in DeKalb County with nearby schools including Allgood Elementary School, Freedom Middle School, and Clarkston High School.
Ownership History
Date
Name
Owned For
Owner Type
Purchase Details
Closed on
Jun 29, 2009
Sold by
Tran Nhien
Bought by
Saphia Tran Nhien and Saphia Son
Current Estimated Value
Home Financials for this Owner
Home Financials are based on the most recent Mortgage that was taken out on this home.
Original Mortgage
$154,906
Outstanding Balance
$98,451
Interest Rate
4.88%
Mortgage Type
FHA
Estimated Equity
$258,642
Purchase Details
Closed on
Jan 6, 2009
Sold by
Diop Annette A
Bought by
Morgan Stanley 2006-He4
Purchase Details
Closed on
Feb 11, 2003
Sold by
Rockbridge Residential Llc
Bought by
Diop Annette
Home Financials for this Owner
Home Financials are based on the most recent Mortgage that was taken out on this home.
Original Mortgage
$187,000
Interest Rate
5.95%
Mortgage Type
New Conventional
Create a Home Valuation Report for This Property
The Home Valuation Report is an in-depth analysis detailing your home's value as well as a comparison with similar homes in the area
Home Values in the Area
Average Home Value in this Area
Purchase History
| Date | Buyer | Sale Price | Title Company |
|---|---|---|---|
| Saphia Tran Nhien | -- | -- | |
| Tran Nhien | $140,000 | -- | |
| Morgan Stanley 2006-He4 | $140,720 | -- | |
| Diop Annette | $189,900 | -- |
Source: Public Records
Mortgage History
| Date | Status | Borrower | Loan Amount |
|---|---|---|---|
| Open | Tran Nhien | $154,906 | |
| Previous Owner | Diop Annette | $187,000 |
Source: Public Records
Tax History
| Year | Tax Paid | Tax Assessment Tax Assessment Total Assessment is a certain percentage of the fair market value that is determined by local assessors to be the total taxable value of land and additions on the property. | Land | Improvement |
|---|---|---|---|---|
| 2025 | $3,133 | $124,640 | $20,000 | $104,640 |
| 2024 | $2,992 | $117,320 | $20,000 | $97,320 |
| 2023 | $2,992 | $116,240 | $20,000 | $96,240 |
Source: Public Records
Map
Nearby Homes
- 885 Granite Springs Ln
- 4820 Banner Elk Dr
- 932 Granite Springs Ln
- 736 Valley Creek Dr
- 4654 Hope Springs Rd
- 4917 Autumn Cir
- 1018 S Hairston Rd
- 819 Arbor Hill Dr
- 917 Lake Watch Dr
- 1044 Autumn Crest Ct
- 1049 Autumn Crest Dr
- 948 Lake Drive Ct
- 1055 Autumn Crest Ct
- 804 Rowland Rd
- 4875 Hairston Place
- 943 Lake Drive Ct Unit 1
- 4871 Pinnacle Dr
- 728 Guide Post Ln
- 4903 Martins Crossing Rd
- 1012 Mainstreet Lake Dr
- 720 Ruby Forest Ct
- 4762 Ruby Forrest Dr
- 4770 Ruby Forrest Dr
- 714 Ruby Forest Ct
- 4879 Ruby Pines Ct
- 4739 Ruby Forrest Dr
- 4879 Ruby Pines
- 4747 Ruby Forrest Dr
- 4731 Ruby Forrest Dr
- 4885 Ruby Pines Ct
- 4885 Ruby Pines Ct Unit 12
- 4716 Ruby Forrest Dr
- 710 Ruby Forest Ct
- 4723 Ruby Forrest Dr
- 4751 Ruby Forrest Dr
- 4761 Ruby Forrest Dr
- 4769 Ruby Forrest Dr Unit 25
- 4769 Ruby Forrest Dr
- 4875 Ruby Pines Ct
- 4670 Hardwood Rd Unit 2
Your Personal Tour Guide
Ask me questions while you tour the home.