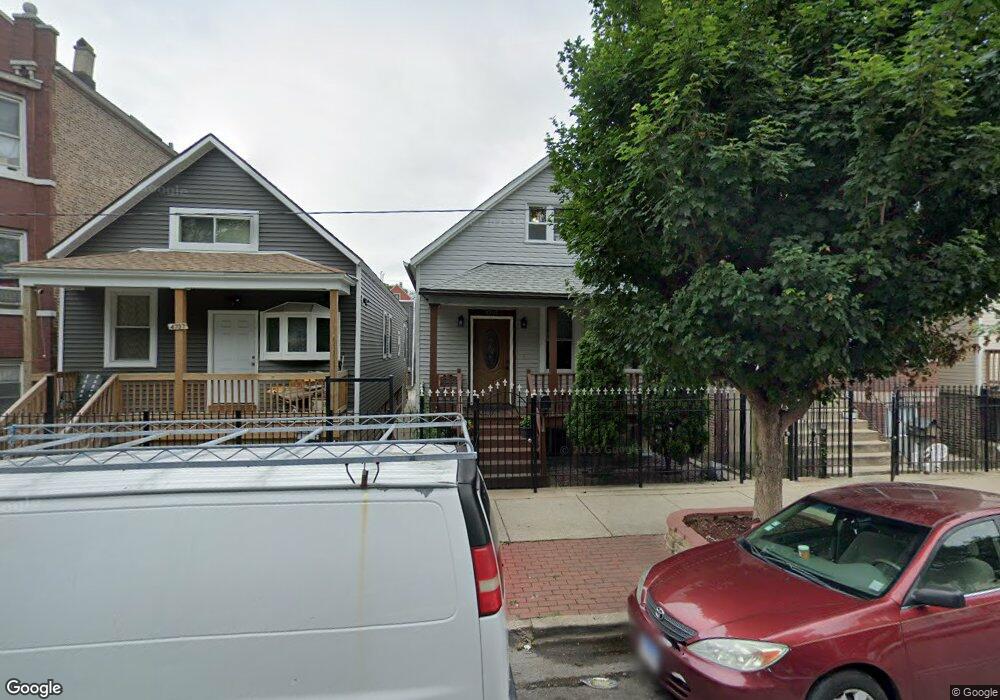
4741 S Wolcott Ave Chicago, IL 60609
Back of the Yards NeighborhoodEstimated Value: $201,000 - $242,000
4
Beds
3
Baths
1,250
Sq Ft
$178/Sq Ft
Est. Value
About This Home
This home is located at 4741 S Wolcott Ave, Chicago, IL 60609 and is currently estimated at $222,438, approximately $177 per square foot. 4741 S Wolcott Ave is a home located in Cook County with nearby schools including Hedges Elementary School.
Ownership History
Date
Name
Owned For
Owner Type
Purchase Details
Closed on
Jan 26, 2017
Sold by
Gonzalez Bertha and Gonzalez Jesus Alberto
Bought by
Galan Ismael
Current Estimated Value
Purchase Details
Closed on
Feb 10, 2014
Sold by
Martinez Galan Jr Ismael and Martinez Cruz Blanca
Bought by
Gonzalez Bertha
Purchase Details
Closed on
Apr 3, 2008
Sold by
Galan Ismael
Bought by
Martinez Galan Jr Ismael and Martinez Cruz Blanca
Purchase Details
Closed on
Apr 27, 2007
Sold by
Munoz Heron
Bought by
Galan Ismael
Home Financials for this Owner
Home Financials are based on the most recent Mortgage that was taken out on this home.
Original Mortgage
$209,000
Interest Rate
6.2%
Mortgage Type
New Conventional
Purchase Details
Closed on
Jan 10, 2007
Sold by
Widup Kim R
Bought by
Munoz Heron
Purchase Details
Closed on
Oct 26, 2005
Sold by
Barboza Jose and Barboza Ana R
Bought by
United States Of America
Purchase Details
Closed on
Jul 14, 1995
Sold by
Rodriguez Rafael and Flores Gloria
Bought by
Barboza Jose A and Barboza Ana R
Create a Home Valuation Report for This Property
The Home Valuation Report is an in-depth analysis detailing your home's value as well as a comparison with similar homes in the area
Home Values in the Area
Average Home Value in this Area
Purchase History
| Date | Buyer | Sale Price | Title Company |
|---|---|---|---|
| Galan Ismael | -- | Attorney | |
| Gonzalez Bertha | $40,500 | Git | |
| Martinez Galan Jr Ismael | -- | Chicago Title Insurance Co | |
| Galan Ismael | $220,000 | Ticor Title Insurance | |
| Munoz Heron | -- | Cti | |
| United States Of America | -- | None Available | |
| Barboza Jose A | $55,000 | -- |
Source: Public Records
Mortgage History
| Date | Status | Borrower | Loan Amount |
|---|---|---|---|
| Previous Owner | Galan Ismael | $209,000 |
Source: Public Records
Tax History Compared to Growth
Tax History
| Year | Tax Paid | Tax Assessment Tax Assessment Total Assessment is a certain percentage of the fair market value that is determined by local assessors to be the total taxable value of land and additions on the property. | Land | Improvement |
|---|---|---|---|---|
| 2024 | $1,206 | $15,000 | $1,875 | $13,125 |
| 2023 | $1,154 | $9,000 | $2,500 | $6,500 |
| 2022 | $1,154 | $9,000 | $2,500 | $6,500 |
| 2021 | $1,140 | $9,000 | $2,500 | $6,500 |
| 2020 | $1,138 | $8,179 | $3,125 | $5,054 |
| 2019 | $1,186 | $9,295 | $3,125 | $6,170 |
| 2018 | $1,165 | $9,295 | $3,125 | $6,170 |
| 2017 | $1,465 | $10,137 | $2,812 | $7,325 |
| 2016 | $2,044 | $10,137 | $2,812 | $7,325 |
| 2015 | $1,871 | $10,137 | $2,812 | $7,325 |
| 2014 | $1,426 | $10,195 | $2,656 | $7,539 |
| 2013 | $1,387 | $10,195 | $2,656 | $7,539 |
Source: Public Records
Map
Nearby Homes
- 1908 W 48th St
- 4800 S Wood St
- 1756 W 48th St
- 1737 W 47th St
- 4739 S Hermitage Ave
- 4944 S Honore St
- 4534 S Honore St
- 4840 S Paulina St
- 4535 S Wood St
- 4514 S Honore St
- 4508 S Wood St
- 4513 S Wood St
- 4530 S Paulina St
- 4446 S Wood St
- 4611 S Marshfield Ave
- 4953 S Paulina St
- 4848 S Ashland Ave
- 4441 S Wood St
- 5031 S Hermitage Ave
- 4943 S Marshfield Ave
- 4745 S Wolcott Ave Unit 1
- 4745 S Wolcott Ave
- 4737 S Wolcott Ave
- 4735 S Wolcott Ave
- 4747 S Wolcott Ave
- 4749 S Wolcott Ave
- 4733 S Wolcott Ave
- 4751 S Wolcott Ave
- 4751 S Wolcott Ave
- 4731 S Wolcott Ave
- 4755 S Wolcott Ave
- 4729 S Wolcott Ave
- 4746 S Honore St
- 4727 S Wolcott Ave Unit 1
- 1842 W 48th St
- 4757 S Wolcott Ave Unit 1
- 4742 S Wolcott Ave
- 4734 S Honore St
- 4740 S Honore St Unit 1
- 4738 S Wolcott Ave