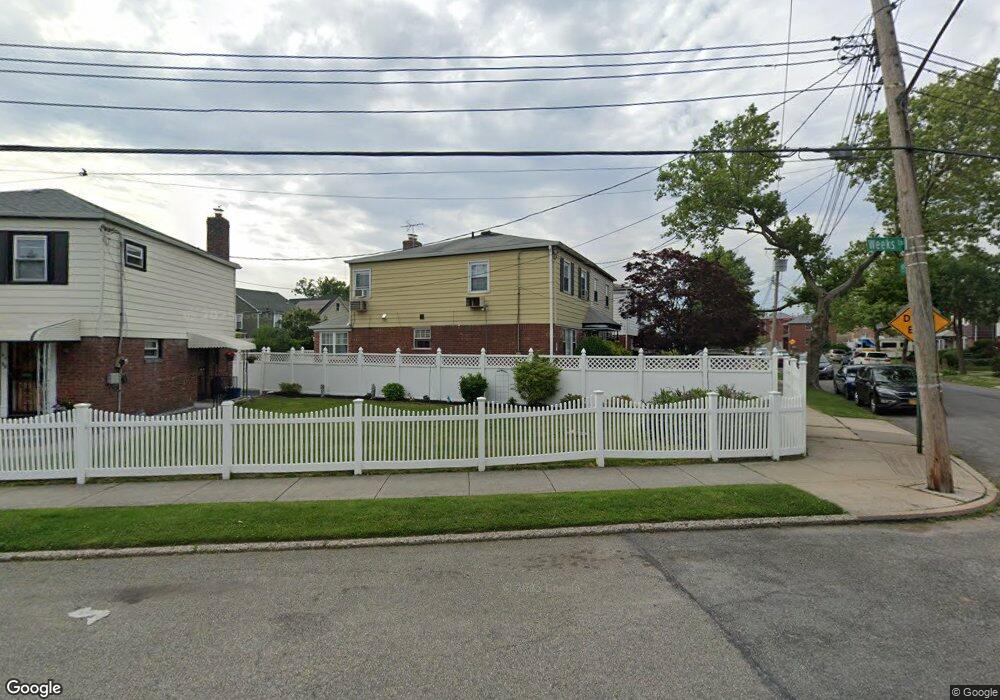
4742 199th St Flushing, NY 11358
Auburndale NeighborhoodEstimated Value: $976,000 - $1,011,000
Studio
--
Bath
1,358
Sq Ft
$733/Sq Ft
Est. Value
About This Home
This home is located at 4742 199th St, Flushing, NY 11358 and is currently estimated at $995,162, approximately $732 per square foot. 4742 199th St is a home located in Queens County with nearby schools including P.S. 162 The John Golden School, M.S. 158 - Marie Curie, and Francis Lewis High School.
Ownership History
Date
Name
Owned For
Owner Type
Purchase Details
Closed on
Nov 19, 2021
Sold by
Ng Wing Lok and Yeung Saupu
Bought by
Park Jae Myung and Park Woo Chang
Current Estimated Value
Home Financials for this Owner
Home Financials are based on the most recent Mortgage that was taken out on this home.
Original Mortgage
$540,000
Outstanding Balance
$495,501
Interest Rate
3.09%
Mortgage Type
Purchase Money Mortgage
Estimated Equity
$499,661
Create a Home Valuation Report for This Property
The Home Valuation Report is an in-depth analysis detailing your home's value as well as a comparison with similar homes in the area
Home Values in the Area
Average Home Value in this Area
Purchase History
| Date | Buyer | Sale Price | Title Company |
|---|---|---|---|
| Park Jae Myung | $790,000 | -- |
Source: Public Records
Mortgage History
| Date | Status | Borrower | Loan Amount |
|---|---|---|---|
| Open | Park Jae Myung | $540,000 |
Source: Public Records
Tax History
| Year | Tax Paid | Tax Assessment Tax Assessment Total Assessment is a certain percentage of the fair market value that is determined by local assessors to be the total taxable value of land and additions on the property. | Land | Improvement |
|---|---|---|---|---|
| 2025 | $8,310 | $43,474 | $11,901 | $31,573 |
| 2024 | $8,310 | $41,374 | $13,242 | $28,132 |
| 2023 | $7,840 | $39,035 | $12,600 | $26,435 |
| 2022 | $7,352 | $51,780 | $15,900 | $35,880 |
| 2021 | $7,624 | $50,220 | $15,900 | $34,320 |
| 2020 | $7,668 | $50,220 | $15,900 | $34,320 |
| 2019 | $7,212 | $47,160 | $15,900 | $31,260 |
| 2018 | $6,333 | $32,529 | $13,661 | $18,868 |
| 2017 | $5,956 | $30,688 | $13,202 | $17,486 |
| 2016 | $5,725 | $30,688 | $13,202 | $17,486 |
| 2015 | $3,272 | $30,190 | $15,018 | $15,172 |
| 2014 | $3,272 | $28,732 | $15,111 | $13,621 |
Source: Public Records
Map
Nearby Homes
- 199-04 47th Ave
- 47-02 Francis Lewis Blvd
- 20206 Rocky Hill Rd Unit C1
- 4756 196th St
- 45-66 196th Place
- 46-38 204th St
- 4552 196th St
- 5312 199th St
- 4604 195th St
- 204-19 46th Rd
- 196-64 45th Ave
- 45-31 195th St
- 4734 206th St
- 200-38 45th Ave
- 48-35 Clearview Expy
- 4719 192nd St
- 46-27 206th St
- 45-47 193rd St
- 53-43 202nd St
- 19005 48th Ave
Your Personal Tour Guide
Ask me questions while you tour the home.