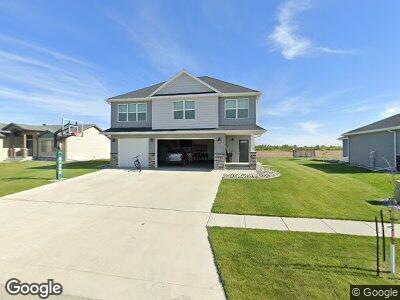
4743 6th St W West Fargo, ND 58078
The Wilds NeighborhoodEstimated Value: $452,000 - $500,089
4
Beds
3
Baths
2,471
Sq Ft
$193/Sq Ft
Est. Value
About This Home
This home is located at 4743 6th St W, West Fargo, ND 58078 and is currently estimated at $476,045, approximately $192 per square foot. 4743 6th St W is a home located in Cass County with nearby schools including Legacy Elementary School, Liberty Middle School, and West Fargo Sheyenne High School.
Ownership History
Date
Name
Owned For
Owner Type
Purchase Details
Closed on
Jul 25, 2019
Sold by
Loegering Thomas and Loegering Justine
Bought by
Sunde Angela M and Sunde Cody O
Current Estimated Value
Home Financials for this Owner
Home Financials are based on the most recent Mortgage that was taken out on this home.
Original Mortgage
$299,700
Outstanding Balance
$265,911
Interest Rate
3.82%
Mortgage Type
New Conventional
Estimated Equity
$210,134
Purchase Details
Closed on
Apr 10, 2014
Sold by
Dabbert Custom Homes Llc
Bought by
Loegering Thomas and Loegering Justine
Home Financials for this Owner
Home Financials are based on the most recent Mortgage that was taken out on this home.
Original Mortgage
$221,563
Interest Rate
4.31%
Mortgage Type
New Conventional
Purchase Details
Closed on
Sep 30, 2013
Sold by
Westport Investments Llc
Bought by
Dabbert Custom Homes Llc
Create a Home Valuation Report for This Property
The Home Valuation Report is an in-depth analysis detailing your home's value as well as a comparison with similar homes in the area
Home Values in the Area
Average Home Value in this Area
Purchase History
| Date | Buyer | Sale Price | Title Company |
|---|---|---|---|
| Sunde Angela M | $333,000 | Title Co | |
| Loegering Thomas | -- | None Available | |
| Dabbert Custom Homes Llc | -- | None Available |
Source: Public Records
Mortgage History
| Date | Status | Borrower | Loan Amount |
|---|---|---|---|
| Open | Sunde Angela M | $299,700 | |
| Previous Owner | Loegering Thomas | $221,563 | |
| Previous Owner | Dabbert Custom Homes Llc | $132,500 |
Source: Public Records
Tax History Compared to Growth
Tax History
| Year | Tax Paid | Tax Assessment Tax Assessment Total Assessment is a certain percentage of the fair market value that is determined by local assessors to be the total taxable value of land and additions on the property. | Land | Improvement |
|---|---|---|---|---|
| 2024 | $7,637 | $210,250 | $40,800 | $169,450 |
| 2023 | $7,911 | $199,350 | $40,800 | $158,550 |
| 2022 | $7,488 | $178,650 | $40,800 | $137,850 |
| 2021 | $7,255 | $166,150 | $32,650 | $133,500 |
| 2020 | $7,134 | $163,100 | $32,650 | $130,450 |
| 2019 | $7,192 | $159,150 | $32,650 | $126,500 |
| 2018 | $7,166 | $161,800 | $32,650 | $129,150 |
| 2017 | $7,126 | $166,650 | $32,650 | $134,000 |
| 2016 | $4,832 | $88,200 | $32,650 | $55,550 |
| 2015 | $4,891 | $85,200 | $32,950 | $52,250 |
| 2014 | $3,919 | $43,600 | $32,950 | $10,650 |
| 2013 | $3,369 | $20,250 | $20,250 | $0 |
Source: Public Records
Map
Nearby Homes