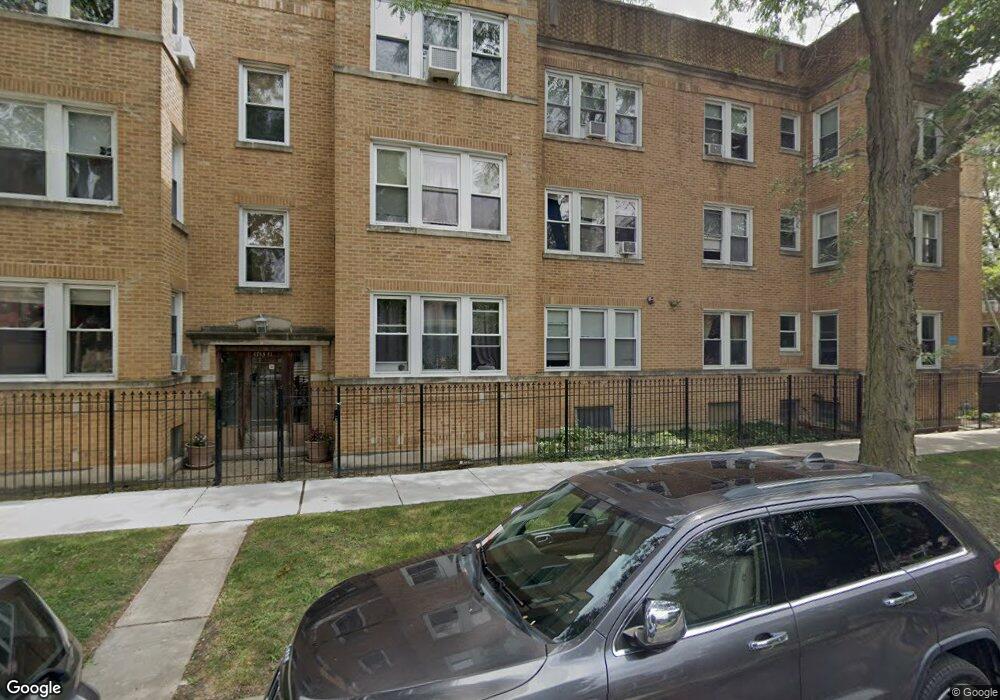
4743 N Hamlin Ave Unit 47431 Chicago, IL 60625
Albany Park NeighborhoodEstimated Value: $164,000 - $229,000
2
Beds
1
Bath
975
Sq Ft
$208/Sq Ft
Est. Value
About This Home
This home is located at 4743 N Hamlin Ave Unit 47431, Chicago, IL 60625 and is currently estimated at $202,600, approximately $207 per square foot. 4743 N Hamlin Ave Unit 47431 is a home located in Cook County with nearby schools including Haugan Elementary School, Roosevelt High School, and ASPIRA Haugan Middle School.
Ownership History
Date
Name
Owned For
Owner Type
Purchase Details
Closed on
Jan 30, 2016
Sold by
Lypak Ofelia
Bought by
Trahey Patrick Michael
Current Estimated Value
Home Financials for this Owner
Home Financials are based on the most recent Mortgage that was taken out on this home.
Original Mortgage
$90,250
Outstanding Balance
$72,638
Interest Rate
4.25%
Mortgage Type
New Conventional
Estimated Equity
$129,962
Purchase Details
Closed on
Oct 14, 2015
Sold by
Nelson Max
Bought by
Lypak Ofelia
Purchase Details
Closed on
May 27, 2003
Sold by
Rpm Property Development Inc
Bought by
Nelson Max
Home Financials for this Owner
Home Financials are based on the most recent Mortgage that was taken out on this home.
Original Mortgage
$119,840
Interest Rate
5.9%
Mortgage Type
Unknown
Create a Home Valuation Report for This Property
The Home Valuation Report is an in-depth analysis detailing your home's value as well as a comparison with similar homes in the area
Home Values in the Area
Average Home Value in this Area
Purchase History
| Date | Buyer | Sale Price | Title Company |
|---|---|---|---|
| Trahey Patrick Michael | $95,000 | First American Title | |
| Lypak Ofelia | $63,000 | Attorney | |
| Nelson Max | $150,000 | Mtc | |
| Nelson Max | $150,000 | Mtc |
Source: Public Records
Mortgage History
| Date | Status | Borrower | Loan Amount |
|---|---|---|---|
| Open | Trahey Patrick Michael | $90,250 | |
| Previous Owner | Nelson Max | $119,840 | |
| Closed | Nelson Max | $29,960 |
Source: Public Records
Tax History Compared to Growth
Tax History
| Year | Tax Paid | Tax Assessment Tax Assessment Total Assessment is a certain percentage of the fair market value that is determined by local assessors to be the total taxable value of land and additions on the property. | Land | Improvement |
|---|---|---|---|---|
| 2024 | $2,752 | $13,111 | $3,045 | $10,066 |
| 2023 | $2,683 | $13,000 | $2,436 | $10,564 |
| 2022 | $2,683 | $13,000 | $2,436 | $10,564 |
| 2021 | $2,622 | $12,998 | $2,435 | $10,563 |
| 2020 | $1,973 | $8,825 | $1,261 | $7,564 |
| 2019 | $1,994 | $9,890 | $1,261 | $8,629 |
| 2018 | $1,960 | $9,890 | $1,261 | $8,629 |
| 2017 | $2,621 | $12,136 | $1,130 | $11,006 |
| 2016 | $2,439 | $12,136 | $1,130 | $11,006 |
| 2015 | $2,232 | $12,136 | $1,130 | $11,006 |
| 2014 | $2,410 | $12,939 | $1,043 | $11,896 |
| 2013 | $2,362 | $12,939 | $1,043 | $11,896 |
Source: Public Records
Map
Nearby Homes
- 3752 W Giddings St Unit 3
- 3711 W Lawrence Ave
- 4901 N Avers Ave Unit 2
- 3816 W Ainslie St Unit 1
- 4619 N Lawndale Ave Unit 1
- 4909 N Avers Ave Unit 3
- 4900 N Lawndale Ave Unit G
- 3849 W Ainslie St Unit 1
- 4855 N Springfield Ave Unit 3
- 4624 N Springfield Ave
- 4614 N Springfield Ave
- 4610 N Monticello Ave Unit 3E
- 4621 N Monticello Ave
- 4855 N Harding Ave Unit 2
- 4904 N Springfield Ave Unit 1
- 3908 W Ainslie St Unit G
- 4919 N Lawndale Ave
- 4903 N Monticello Ave Unit 3
- 3618 W Ainslie St Unit 3W
- 4734 N Drake Ave
- 4743 N Hamlin Ave Unit 2A
- 4741 N Hamlin Ave Unit 47412
- 4743 N Hamlin Ave Unit 47433
- 4743 N Hamlin Ave Unit 47432
- 4741 N Hamlin Ave Unit 47413
- 4741 N Hamlin Ave Unit 1
- 4741 N Hamlin Ave Unit 3
- 4743 N Hamlin Ave Unit 3
- 4743 N Hamlin Ave Unit 2
- 4743 N Hamlin Ave Unit 1
- 3750 W Giddings St Unit 37502
- 3750 W Giddings St Unit 37503
- 3750 W Giddings St Unit 37501
- 3750 W Giddings St Unit 3
- 3750 W Giddings St Unit 2
- 3746 W Giddings St
- 3744 W Giddings St
- 3740 W Giddings St
- 3755 W Lawrence Ave
- 3736 W Giddings St