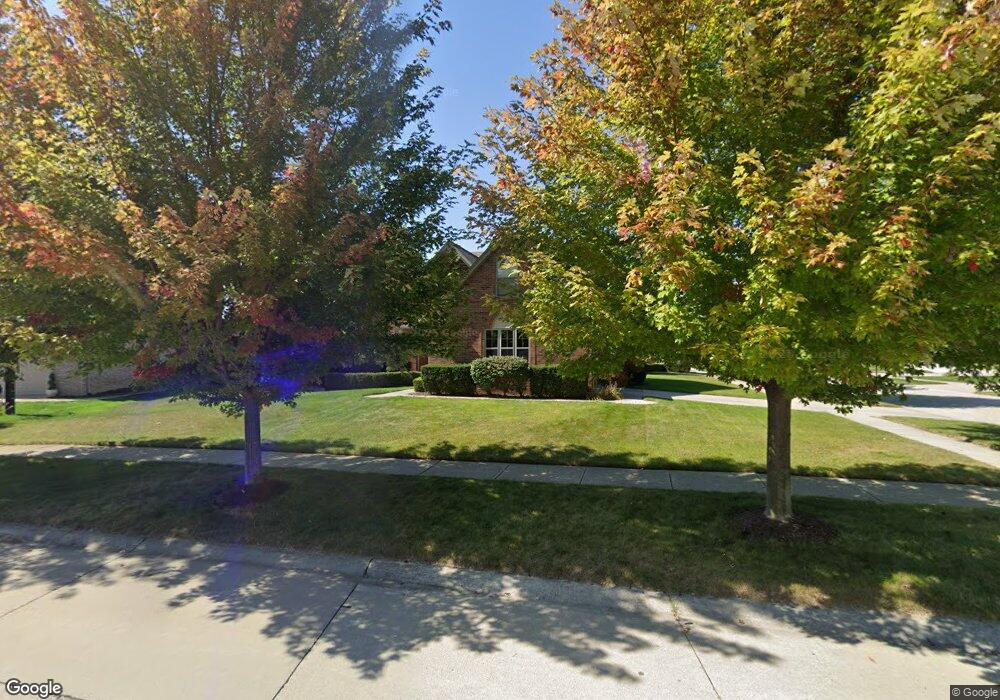
47435 Prescot Dr Unit 166 Macomb, MI 48044
Estimated Value: $529,000 - $631,000
5
Beds
3
Baths
2,850
Sq Ft
$198/Sq Ft
Est. Value
About This Home
This home is located at 47435 Prescot Dr Unit 166, Macomb, MI 48044 and is currently estimated at $563,435, approximately $197 per square foot. 47435 Prescot Dr Unit 166 is a home located in Macomb County with nearby schools including Ojibwa Elementary School, Seneca Middle School, and Dakota High School.
Ownership History
Date
Name
Owned For
Owner Type
Purchase Details
Closed on
Feb 24, 2009
Sold by
American Heartland Homebuilder Llc
Bought by
Brown Richard J and Churgin Brown Jennifer
Current Estimated Value
Purchase Details
Closed on
Mar 27, 2008
Sold by
Rcm Land Development Llc
Bought by
American Heartland Homebuilder Llc
Purchase Details
Closed on
Nov 22, 2005
Sold by
American Heartland Homebuilder Llc
Bought by
Rcm Land Developments Llc
Home Financials for this Owner
Home Financials are based on the most recent Mortgage that was taken out on this home.
Original Mortgage
$3,876,000
Interest Rate
6.2%
Mortgage Type
Purchase Money Mortgage
Create a Home Valuation Report for This Property
The Home Valuation Report is an in-depth analysis detailing your home's value as well as a comparison with similar homes in the area
Home Values in the Area
Average Home Value in this Area
Purchase History
| Date | Buyer | Sale Price | Title Company |
|---|---|---|---|
| Brown Richard J | $226,500 | None Available | |
| American Heartland Homebuilder Llc | -- | Greco | |
| Rcm Land Developments Llc | -- | Greco | |
| American Heartland Homebuilder Llc | $2,416,344 | Greco |
Source: Public Records
Mortgage History
| Date | Status | Borrower | Loan Amount |
|---|---|---|---|
| Previous Owner | Rcm Land Developments Llc | $3,876,000 |
Source: Public Records
Tax History
| Year | Tax Paid | Tax Assessment Tax Assessment Total Assessment is a certain percentage of the fair market value that is determined by local assessors to be the total taxable value of land and additions on the property. | Land | Improvement |
|---|---|---|---|---|
| 2025 | $4,241 | $255,000 | $0 | $0 |
| 2024 | $41 | $239,200 | $0 | $0 |
| 2023 | $3,911 | $203,800 | $0 | $0 |
| 2022 | $4,858 | $190,400 | $0 | $0 |
| 2021 | $4,727 | $183,400 | $0 | $0 |
| 2020 | $3,588 | $176,900 | $0 | $0 |
| 2019 | $4,373 | $170,300 | $0 | $0 |
| 2018 | $4,261 | $162,200 | $0 | $0 |
| 2017 | $4,194 | $157,250 | $34,500 | $122,750 |
| 2016 | $3,978 | $157,230 | $0 | $0 |
| 2015 | $3,925 | $148,170 | $0 | $0 |
| 2014 | $3,925 | $131,730 | $23,500 | $108,230 |
| 2013 | $5,803 | $131,730 | $0 | $0 |
Source: Public Records
Map
Nearby Homes
- 47376 Hidden Meadows Dr
- 47033 Woodberry Estates Dr
- 47400 Card Rd
- 22377 Massey Ln
- 47848 Card Rd
- 46536 Red River Dr
- 47846 North Ave
- 44604 Bonapart
- 23199 Hidden Creek Dr
- 21310 Boquet Dr
- 23206 21 Mile Rd
- 21258 Fairfield Dr
- 46856 Jewel Unit 8
- 46403 Le Grande Blvd
- 47338 Hunters Chase Dr
- 21254 Clayton Dr
- 21220 Briar Rose Dr
- 21370 Carlton Dr
- 21559 Waverly Dr
- 45954 Bonaventure Dr
- 22191 Sandalwood Dr
- 22322 Sandalwood Dr
- 22313 Sandalwood Dr Unit 184
- 47404 Brennan Dr Unit 220
- 22386 Beech Knoll Dr
- 47404 Brennan Dr
- 22272 Woodlake Dr
- 47409 Prescot Dr Unit 165
- 22218 Sandalwood Dr Unit 167
- 47540 Bucci Ct Unit 180
- 22200 Sandalwood Dr Unit 168
- 47383 Prescot Dr Unit 164
- 47396 Prescot Dr Unit 191
- 22295 Sandalwood Dr
- 22277 Sandalwood Dr
- 47370 Prescot Dr Unit 192
- 47357 Prescot Dr
- 47566 Bucci Ct
- 47566 Bucci Ct Unit 179
- 22182 Sandalwood Dr Unit 169
Your Personal Tour Guide
Ask me questions while you tour the home.