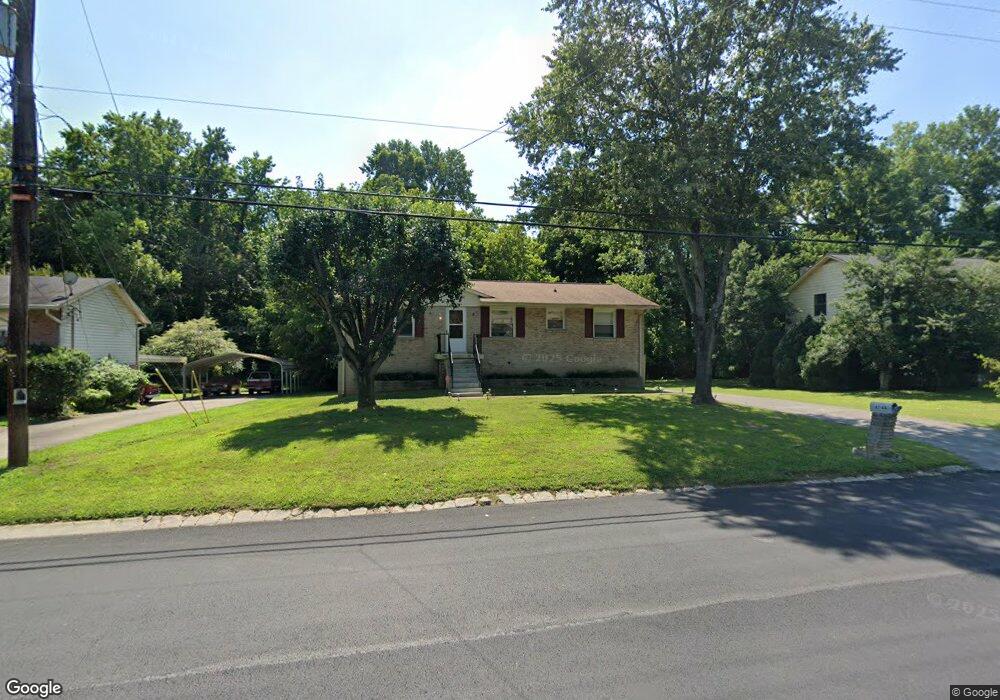
4744 Cascade Dr Old Hickory, TN 37138
Hermitage NeighborhoodEstimated Value: $291,000 - $403,000
3
Beds
2
Baths
1,774
Sq Ft
$202/Sq Ft
Est. Value
About This Home
This home is located at 4744 Cascade Dr, Old Hickory, TN 37138 and is currently estimated at $358,442, approximately $202 per square foot. 4744 Cascade Dr is a home located in Davidson County with nearby schools including Andrew Jackson Elementary School, Dupont-Hadley Middle School, and McGavock High School.
Ownership History
Date
Name
Owned For
Owner Type
Purchase Details
Closed on
Apr 25, 2010
Sold by
Leach Harold R
Bought by
Leach Harold R and Trust B Estelle K Leach Credit Shelter T
Current Estimated Value
Purchase Details
Closed on
Apr 17, 2010
Sold by
Maloney A L
Bought by
Leach Harold R and Leach Family Living Trust
Purchase Details
Closed on
Jul 26, 2004
Sold by
Leach Harold
Bought by
4744 Cascade Drive Land Trust
Purchase Details
Closed on
May 20, 2004
Sold by
4744 Cascade Drive Land Trust
Bought by
Leach Harold
Purchase Details
Closed on
Oct 21, 2002
Sold by
Leach Harold R and Leach Estelle K
Bought by
4744 Cascade Drive Land Trust
Purchase Details
Closed on
Feb 16, 1999
Sold by
Maloney A L Trustee
Bought by
Leach Harold R and Leach Estelle K
Home Financials for this Owner
Home Financials are based on the most recent Mortgage that was taken out on this home.
Original Mortgage
$78,000
Interest Rate
6.84%
Create a Home Valuation Report for This Property
The Home Valuation Report is an in-depth analysis detailing your home's value as well as a comparison with similar homes in the area
Home Values in the Area
Average Home Value in this Area
Purchase History
| Date | Buyer | Sale Price | Title Company |
|---|---|---|---|
| Leach Harold R | -- | None Available | |
| Leach Harold R | -- | None Available | |
| 4744 Cascade Drive Land Trust | -- | Southeast Title Of Tn Inc | |
| Leach Harold | -- | Southeast Title Of Tn Inc | |
| 4744 Cascade Drive Land Trust | -- | -- | |
| Leach Harold R | -- | Centennial Title Company Inc |
Source: Public Records
Mortgage History
| Date | Status | Borrower | Loan Amount |
|---|---|---|---|
| Previous Owner | Leach Harold R | $78,000 |
Source: Public Records
Tax History Compared to Growth
Tax History
| Year | Tax Paid | Tax Assessment Tax Assessment Total Assessment is a certain percentage of the fair market value that is determined by local assessors to be the total taxable value of land and additions on the property. | Land | Improvement |
|---|---|---|---|---|
| 2024 | $1,625 | $55,625 | $12,500 | $43,125 |
| 2023 | $1,625 | $55,625 | $12,500 | $43,125 |
| 2022 | $1,625 | $55,625 | $12,500 | $43,125 |
| 2021 | $1,643 | $55,625 | $12,500 | $43,125 |
| 2020 | $1,206 | $31,850 | $8,750 | $23,100 |
| 2019 | $877 | $31,850 | $8,750 | $23,100 |
| 2018 | $877 | $31,850 | $8,750 | $23,100 |
| 2017 | $877 | $31,850 | $8,750 | $23,100 |
| 2016 | $1,139 | $29,025 | $6,250 | $22,775 |
| 2015 | $1,139 | $29,025 | $6,250 | $22,775 |
| 2014 | $1,139 | $29,025 | $6,250 | $22,775 |
Source: Public Records
Map
Nearby Homes
- 4741 Cascade Dr
- 4768 Cascade Dr
- 1884 Brookmeadow Ln
- 1869 Brookmeadow Ln
- 2309 Crescent Valley Place
- 301 Griffin Place Unit 118
- 4840 Shasta Dr
- 4852 Everest Dr
- 516 Griffin Cir Unit 22
- 604 Weatherbeaten Place Unit 604
- 21 Shshone Ct
- 4924 Whittier Dr
- 104 Saddle Tree Ct
- 220 Harpers Mill Ct Unit 220
- 1033 Wyntergrace Farm Rd
- 222 Blue Ridge Dr
- 130 General Jackson Ln Unit 2
- 1813 Woodland Farms Ct
- 4743 Trenton Dr
- 806 Bexhill Ct N
- 4740 Cascade Dr
- 4748 Cascade Dr
- 4738 Cascade Dr
- 4736 Cascade Dr
- 4752 Cascade Dr
- 4754 Cascade Dr
- 4737 Cascade Dr
- 4733 Cascade Dr
- 4732 Cascade Dr
- 4756 Cascade Dr
- 4731 Cascade Dr
- 4745 Cascade Dr
- 4729 Cascade Dr
- 4749 Cascade Dr
- 4728 Cascade Dr
- 4725 Cascade Dr
- 4762 Cascade Dr
- 4751 Cascade Dr
- 2249 Crescent Valley Ln
- 4760 Cascade Dr