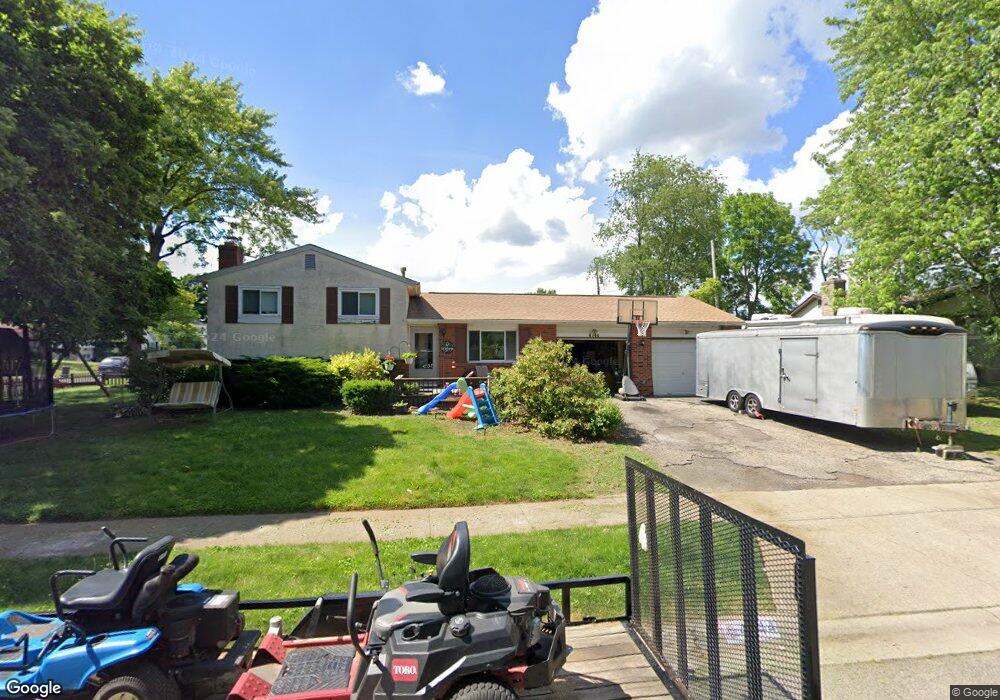
4744 Glengate Dr Columbus, OH 43232
East Columbus-White Ash NeighborhoodEstimated Value: $203,000 - $220,000
3
Beds
2
Baths
1,284
Sq Ft
$165/Sq Ft
Est. Value
About This Home
This home is located at 4744 Glengate Dr, Columbus, OH 43232 and is currently estimated at $212,021, approximately $165 per square foot. 4744 Glengate Dr is a home located in Franklin County with nearby schools including Groveport Madison High School, Eastland Preparatory Academy, and Zenith Academy East.
Ownership History
Date
Name
Owned For
Owner Type
Purchase Details
Closed on
Jan 6, 2009
Sold by
Lasalle Bank National Association
Bought by
Hutchinson Marshall D
Current Estimated Value
Home Financials for this Owner
Home Financials are based on the most recent Mortgage that was taken out on this home.
Original Mortgage
$80,931
Outstanding Balance
$52,104
Interest Rate
5.53%
Mortgage Type
FHA
Estimated Equity
$159,917
Purchase Details
Closed on
Jul 9, 2008
Sold by
Cassell Douglas E and Case #07Cve11 15213
Bought by
Lasalle Bank Na and First Franklin Mortgage Loan Trust 2007-
Purchase Details
Closed on
Nov 1, 2006
Sold by
Moynihan Donald R and Moynihan Beatrice L
Bought by
Cassell Douglas E and Cassell Marva R
Home Financials for this Owner
Home Financials are based on the most recent Mortgage that was taken out on this home.
Original Mortgage
$119,900
Interest Rate
6.36%
Mortgage Type
Balloon
Purchase Details
Closed on
May 9, 1969
Bought by
Moynihan Donald R
Create a Home Valuation Report for This Property
The Home Valuation Report is an in-depth analysis detailing your home's value as well as a comparison with similar homes in the area
Home Values in the Area
Average Home Value in this Area
Purchase History
| Date | Buyer | Sale Price | Title Company |
|---|---|---|---|
| Hutchinson Marshall D | $82,000 | Landcastle | |
| Lasalle Bank Na | $82,600 | None Available | |
| Cassell Douglas E | $119,900 | Attorney | |
| Moynihan Donald R | -- | -- |
Source: Public Records
Mortgage History
| Date | Status | Borrower | Loan Amount |
|---|---|---|---|
| Open | Hutchinson Marshall D | $80,931 | |
| Previous Owner | Cassell Douglas E | $119,900 |
Source: Public Records
Tax History Compared to Growth
Tax History
| Year | Tax Paid | Tax Assessment Tax Assessment Total Assessment is a certain percentage of the fair market value that is determined by local assessors to be the total taxable value of land and additions on the property. | Land | Improvement |
|---|---|---|---|---|
| 2024 | $3,163 | $65,380 | $14,630 | $50,750 |
| 2023 | $3,141 | $65,380 | $14,630 | $50,750 |
| 2022 | $2,175 | $35,920 | $7,880 | $28,040 |
| 2021 | $2,219 | $35,920 | $7,880 | $28,040 |
| 2020 | $2,224 | $35,920 | $7,880 | $28,040 |
| 2019 | $2,131 | $30,250 | $6,550 | $23,700 |
| 2018 | $2,216 | $30,250 | $6,550 | $23,700 |
| 2017 | $2,154 | $30,250 | $6,550 | $23,700 |
| 2016 | $2,285 | $29,160 | $6,060 | $23,100 |
| 2015 | $2,290 | $29,160 | $6,060 | $23,100 |
| 2014 | $2,111 | $29,160 | $6,060 | $23,100 |
| 2013 | $1,018 | $32,375 | $6,720 | $25,655 |
Source: Public Records
Map
Nearby Homes
- 4655 Glengate Dr
- 4496 Reinbeau Dr
- 4468 Reinbeau Dr
- 4940 Brewster Dr
- 5004 Bentler Dr
- 3496 Cadell Rd
- 5044 Albany Dr
- 3567 Wymore Place
- 4521 Helen Dr
- 3721 Aurelia Dr
- 5106 Harbor Blvd
- 4485 Helen Dr
- 3493 Tremaine Rd
- 4486 Helen Dr
- 4479 Gerling Blvd
- 3900 Noe Bixby Rd
- 4783 Nieles Edge Dr
- 5096 Fullerton Dr
- 3856 Crestfield Dr Unit 3856
- 4784 Nieles Edge Dr
- 3436 Graystone Dr
- 354 Graystone Dr
- 4752 Glengate Dr
- 4745 Glengate Dr
- 4760 Glengate Dr
- 4728 Glengate Dr
- 4755 Glengate Dr
- 3420 Graystone Dr
- 3476 Graystone Dr
- 3437 Graystone Dr
- 3417 Windridge Dr
- 4729 Glengate Dr
- 4768 Glengate Dr
- 4769 Glengate Dr
- 3429 Graystone Dr
- 3414 Graystone Dr
- 4593 Stratford Ln
- 3484 Graystone Dr
- 3411 Windridge Dr
- 4720 Glengate Dr