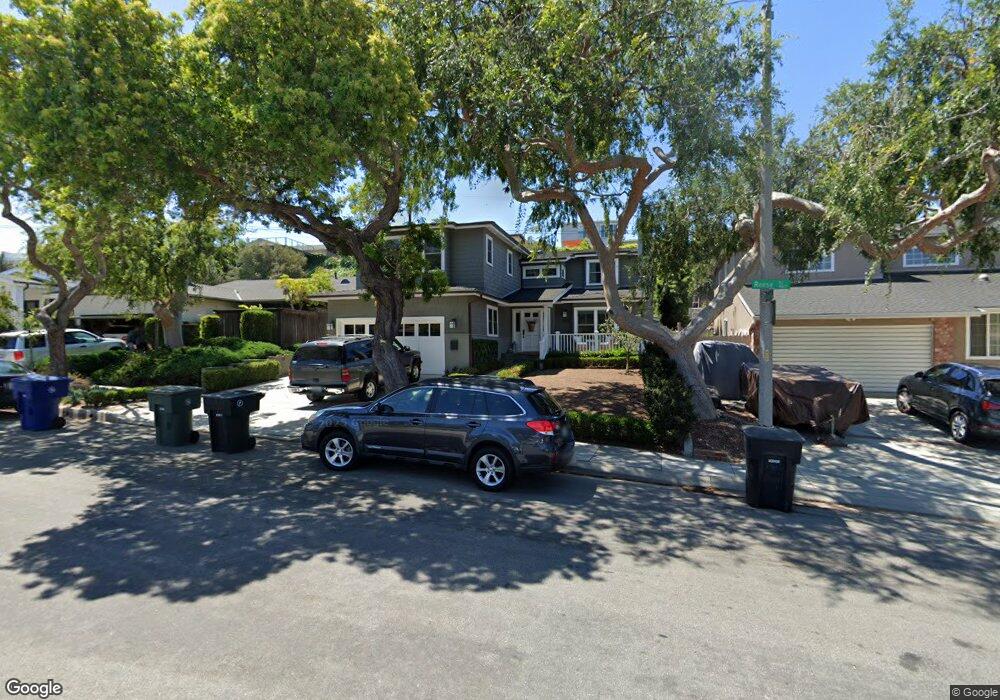
4744 Reese Rd Torrance, CA 90505
Seaside NeighborhoodEstimated Value: $1,728,000 - $1,879,000
4
Beds
3
Baths
2,370
Sq Ft
$761/Sq Ft
Est. Value
About This Home
This home is located at 4744 Reese Rd, Torrance, CA 90505 and is currently estimated at $1,803,568, approximately $760 per square foot. 4744 Reese Rd is a home located in Los Angeles County with nearby schools including Seaside Elementary School, Calle Mayor Middle School, and South High School.
Ownership History
Date
Name
Owned For
Owner Type
Purchase Details
Closed on
Oct 8, 2016
Sold by
Delio Charles A
Bought by
Delio Ii Charles A and Delio Kathleen R
Current Estimated Value
Home Financials for this Owner
Home Financials are based on the most recent Mortgage that was taken out on this home.
Original Mortgage
$415,000
Interest Rate
3.42%
Mortgage Type
New Conventional
Purchase Details
Closed on
Oct 18, 2010
Sold by
Delio Charles A and Delio Kathleen R
Bought by
Delio Ii Charles A and Delio Kathleen R
Home Financials for this Owner
Home Financials are based on the most recent Mortgage that was taken out on this home.
Original Mortgage
$461,800
Interest Rate
4.31%
Mortgage Type
New Conventional
Purchase Details
Closed on
May 30, 2008
Sold by
Delio Charles Arthur and Delio Kathleen R
Bought by
Delio Ii Charles A
Create a Home Valuation Report for This Property
The Home Valuation Report is an in-depth analysis detailing your home's value as well as a comparison with similar homes in the area
Home Values in the Area
Average Home Value in this Area
Purchase History
| Date | Buyer | Sale Price | Title Company |
|---|---|---|---|
| Delio Ii Charles A | -- | North American Title | |
| Delio Ii Charles A | -- | North American Title | |
| Delio Ii Charles A | -- | None Available | |
| Delio Ii Charles A | -- | Chicago Title Company | |
| Delio Ii Charles A | -- | None Available |
Source: Public Records
Mortgage History
| Date | Status | Borrower | Loan Amount |
|---|---|---|---|
| Closed | Delio Ii Charles A | $415,000 | |
| Closed | Delio Ii Charles A | $461,800 |
Source: Public Records
Tax History Compared to Growth
Tax History
| Year | Tax Paid | Tax Assessment Tax Assessment Total Assessment is a certain percentage of the fair market value that is determined by local assessors to be the total taxable value of land and additions on the property. | Land | Improvement |
|---|---|---|---|---|
| 2025 | $6,719 | $582,107 | $288,543 | $293,564 |
| 2024 | $6,719 | $570,694 | $282,886 | $287,808 |
| 2023 | $6,596 | $559,505 | $277,340 | $282,165 |
| 2022 | $6,507 | $548,535 | $271,902 | $276,633 |
| 2021 | $6,380 | $537,780 | $266,571 | $271,209 |
| 2019 | $6,195 | $521,831 | $258,665 | $263,166 |
| 2018 | $6,006 | $511,600 | $253,594 | $258,006 |
| 2016 | $5,723 | $491,737 | $243,748 | $247,989 |
| 2015 | $5,599 | $484,351 | $240,087 | $244,264 |
| 2014 | $5,457 | $474,865 | $235,385 | $239,480 |
Source: Public Records
Map
Nearby Homes
- 4817 Macafee Rd
- 5013 Macafee Rd
- 22709 Gaycrest Ave
- 22828 Anza Ave
- 4226 W 230th Place
- 22721 Marjorie Ave
- 5312 Doris Way
- 22404 Reynolds Dr
- 5608 Palos Verdes Blvd
- 22933 Galva Ave
- 5510 Greenmeadows St
- 22516 Marjorie Ave
- 1703 Circle Dr
- 23552 Kathryn Ave
- 22305 Ladeene Ave
- 23608 Kathryn Ave
- 4020 W 234th Place
- 4402 Cathann St
- 447 Avenue E
- 23318 Ocean Ave
- 4740 Reese Rd
- 4806 Reese Rd
- 4736 Reese Rd
- 4812 Reese Rd
- 4741 Bindewald Rd
- 4737 Bindewald Rd
- 4805 Bindewald Rd
- 4732 Reese Rd
- 4733 Bindewald Rd
- 4818 Reese Rd
- 4729 Bindewald Rd
- 4741 Reese Rd
- 4809 Bindewald Rd
- 4728 Reese Rd
- 4737 Reese Rd
- 4807 Reese Rd
- 4725 Bindewald Rd
- 4733 Reese Rd
- 4824 Reese Rd
- 4813 Reese Rd