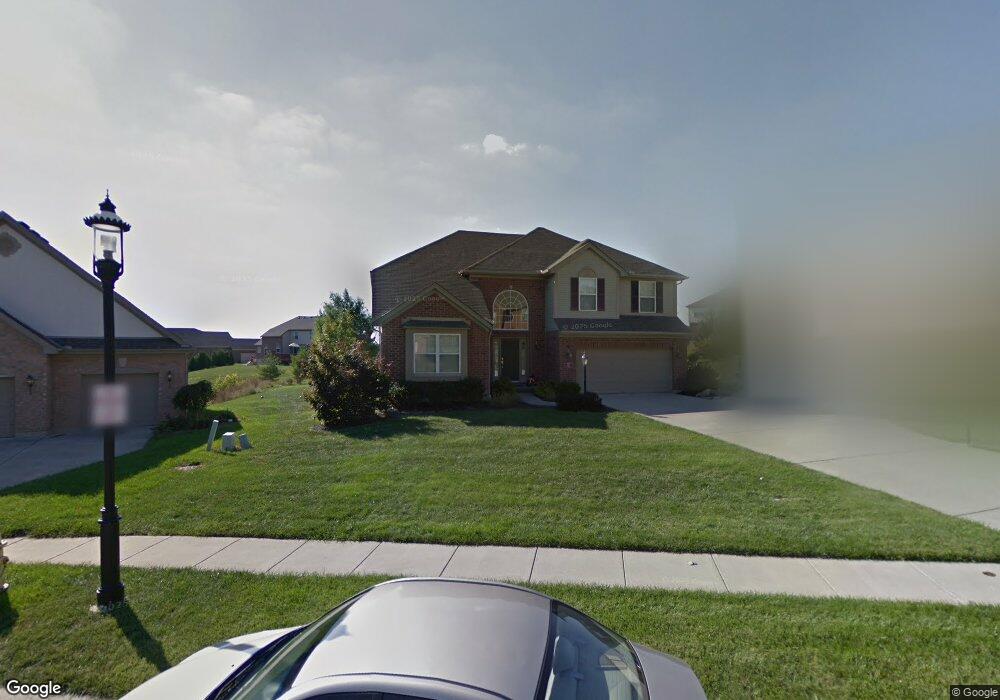
4745 Highland Oaks Dr Cincinnati, OH 45248
Estimated Value: $453,748 - $535,000
4
Beds
3
Baths
2,332
Sq Ft
$212/Sq Ft
Est. Value
About This Home
This home is located at 4745 Highland Oaks Dr, Cincinnati, OH 45248 and is currently estimated at $494,187, approximately $211 per square foot. 4745 Highland Oaks Dr is a home located in Hamilton County with nearby schools including Charles W Springmyer Elementary School, Bridgetown Middle School, and Oak Hills High School.
Ownership History
Date
Name
Owned For
Owner Type
Purchase Details
Closed on
Mar 17, 2003
Sold by
Meyer Builders Douglas Homes Ltd
Bought by
Kessler Daniel F and Kessler Sarah R
Current Estimated Value
Home Financials for this Owner
Home Financials are based on the most recent Mortgage that was taken out on this home.
Original Mortgage
$222,800
Outstanding Balance
$95,711
Interest Rate
5.87%
Estimated Equity
$398,476
Purchase Details
Closed on
Dec 18, 2002
Sold by
Highland Land Group Ltd
Bought by
Meyer Builders Douglas Homes Ltd
Home Financials for this Owner
Home Financials are based on the most recent Mortgage that was taken out on this home.
Original Mortgage
$14,000,000
Outstanding Balance
$6,009,326
Interest Rate
6.23%
Mortgage Type
Credit Line Revolving
Estimated Equity
-$5,515,139
Create a Home Valuation Report for This Property
The Home Valuation Report is an in-depth analysis detailing your home's value as well as a comparison with similar homes in the area
Home Values in the Area
Average Home Value in this Area
Purchase History
| Date | Buyer | Sale Price | Title Company |
|---|---|---|---|
| Kessler Daniel F | $262,300 | Advanced Land Title Agency L | |
| Meyer Builders Douglas Homes Ltd | $414,000 | First Title Agency Inc |
Source: Public Records
Mortgage History
| Date | Status | Borrower | Loan Amount |
|---|---|---|---|
| Open | Kessler Daniel F | $222,800 | |
| Open | Meyer Builders Douglas Homes Ltd | $14,000,000 |
Source: Public Records
Tax History Compared to Growth
Tax History
| Year | Tax Paid | Tax Assessment Tax Assessment Total Assessment is a certain percentage of the fair market value that is determined by local assessors to be the total taxable value of land and additions on the property. | Land | Improvement |
|---|---|---|---|---|
| 2024 | $6,707 | $125,440 | $24,955 | $100,485 |
| 2023 | $6,592 | $125,440 | $24,955 | $100,485 |
| 2022 | $6,220 | $100,699 | $24,304 | $76,395 |
| 2021 | $5,714 | $100,699 | $24,304 | $76,395 |
| 2020 | $5,645 | $100,699 | $24,304 | $76,395 |
| 2019 | $5,552 | $89,908 | $21,700 | $68,208 |
| 2018 | $5,557 | $89,908 | $21,700 | $68,208 |
| 2017 | $5,308 | $89,908 | $21,700 | $68,208 |
| 2016 | $5,031 | $84,203 | $21,840 | $62,363 |
| 2015 | $5,007 | $84,203 | $21,840 | $62,363 |
| 2014 | $5,006 | $84,203 | $21,840 | $62,363 |
| 2013 | $4,882 | $87,710 | $22,750 | $64,960 |
Source: Public Records
Map
Nearby Homes
- 4870 Highland Oaks Dr
- 6831 Wesselman Rd
- 3105 Laurel Hill Ln
- 6419 Louese Ln
- 10 Priya Place
- 6537 Chesapeake Run
- 5124 Halifax Dr
- 6880 Rackview Rd
- 6548 Springmyer Dr
- 7208 Taylor Rd
- 6295 Eagles Lake Dr
- 6604 Hearne Rd
- 6989 Carlinridge Ln
- 4295 Ebenezer Rd
- 6617 Hearne Rd
- 6644 Hearne Rd
- 6602 Hearne Rd
- 6588 Hearne Rd
- 6404 Springmyer Dr
- 4286 Ebenezer Rd
- 4761 Highland Oaks Dr
- 4733 Highland Oaks Dr
- 4764 Haven Crest Ln
- 4778 Haven Crest Ln
- 4775 Highland Oaks Dr
- 4727 Highland Oaks Dr
- 6745 Legacy Ridge Ln
- 4754 Highland Oaks Dr
- 4756 Haven Crest Ln
- 4746 Highland Oaks Dr
- 4732 Highland Oaks Dr
- 4770 Highland Oaks Dr
- 4786 Highland Oaks Dr
- 4748 Haven Crest Ln
- 4755 Haven Crest Ln
- 4777 Haven Crest Ln
- 6740 Legacy Ridge Ln
- 6730 Legacy Ridge Ln
- 4789 Haven Crest Ln
- a Highland Oaks Dr