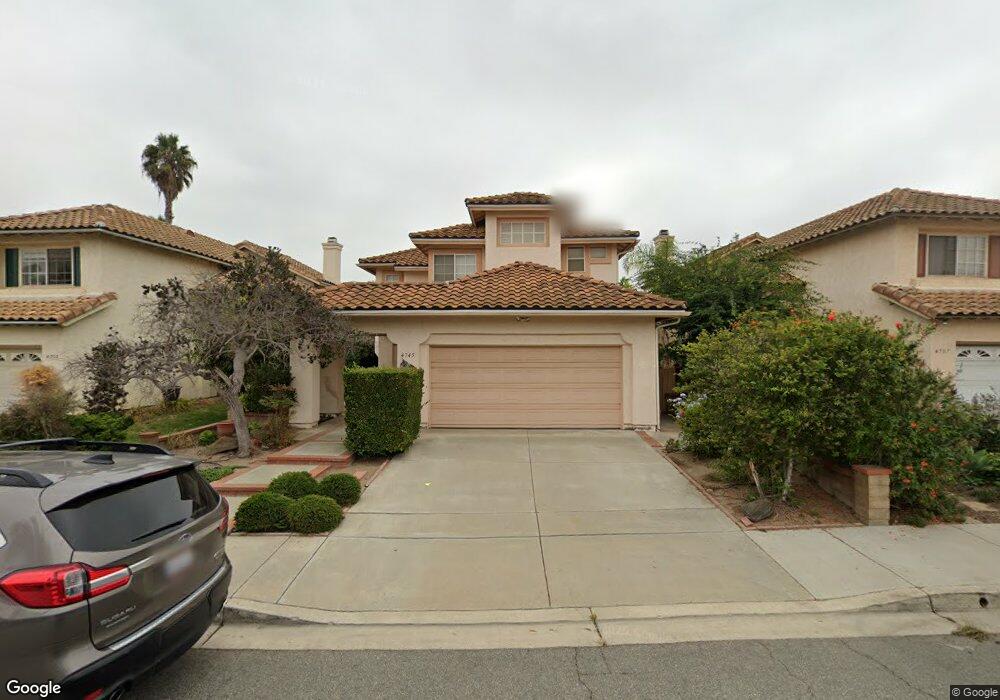
4745 Via Escala Oceanside, CA 92056
Ivey Ranch-Rancho Del Oro NeighborhoodEstimated Value: $922,500 - $1,018,000
4
Beds
3
Baths
2,196
Sq Ft
$441/Sq Ft
Est. Value
About This Home
This home is located at 4745 Via Escala, Oceanside, CA 92056 and is currently estimated at $968,875, approximately $441 per square foot. 4745 Via Escala is a home located in San Diego County with nearby schools including Empresa Elementary School, Roosevelt Middle School, and Vista High School.
Ownership History
Date
Name
Owned For
Owner Type
Purchase Details
Closed on
Aug 25, 2011
Sold by
Willis Teddy B and Willis Charlene
Bought by
Vu Don Hoang and Vu Lonnie Ngoc
Current Estimated Value
Home Financials for this Owner
Home Financials are based on the most recent Mortgage that was taken out on this home.
Original Mortgage
$150,000
Outstanding Balance
$101,504
Interest Rate
4.09%
Mortgage Type
New Conventional
Estimated Equity
$867,371
Purchase Details
Closed on
Jun 17, 1996
Sold by
Grover Family Trust 11-08-90 and Grover Fred
Bought by
Willis Teddy B and Willis Charlene
Home Financials for this Owner
Home Financials are based on the most recent Mortgage that was taken out on this home.
Original Mortgage
$143,600
Interest Rate
8.03%
Mortgage Type
Balloon
Purchase Details
Closed on
Jan 8, 1990
Create a Home Valuation Report for This Property
The Home Valuation Report is an in-depth analysis detailing your home's value as well as a comparison with similar homes in the area
Home Values in the Area
Average Home Value in this Area
Purchase History
We collect this data history from publicly available records. To have your information removed, we recommend requesting removal directly through your county’s website.
| Date | Buyer | Sale Price | Title Company |
|---|---|---|---|
| Vu Don Hoang | $350,000 | Pacific Coast Title | |
| Willis Teddy B | $179,500 | Southland Title | |
| -- | $225,500 | -- |
Source: Public Records
Mortgage History
We collect this data history from publicly available records. To have your information removed, we recommend requesting removal directly through your county’s website.
| Date | Status | Borrower | Loan Amount |
|---|---|---|---|
| Open | Vu Don Hoang | $150,000 | |
| Previous Owner | Willis Teddy B | $143,600 |
Source: Public Records
Tax History
| Year | Tax Paid | Tax Assessment Tax Assessment Total Assessment is a certain percentage of the fair market value that is determined by local assessors to be the total taxable value of land and additions on the property. | Land | Improvement |
|---|---|---|---|---|
| 2025 | $4,720 | $439,605 | $129,286 | $310,319 |
| 2024 | $4,720 | $430,986 | $126,751 | $304,235 |
| 2023 | $4,607 | $422,536 | $124,266 | $298,270 |
| 2022 | $4,595 | $414,252 | $121,830 | $292,422 |
| 2021 | $4,492 | $406,131 | $119,442 | $286,689 |
| 2020 | $4,483 | $401,968 | $118,218 | $283,750 |
| 2019 | $4,417 | $394,087 | $115,900 | $278,187 |
| 2018 | $4,205 | $386,361 | $113,628 | $272,733 |
| 2017 | $4,128 | $378,786 | $111,400 | $267,386 |
| 2016 | $4,030 | $371,360 | $109,216 | $262,144 |
| 2015 | $4,015 | $365,783 | $107,576 | $258,207 |
| 2014 | $3,916 | $358,619 | $105,469 | $253,150 |
Source: Public Records
Map
Nearby Homes
- 1593 Avenida Guillermo
- 4228 Conquistador
- 1899 Corte Torero
- 1278 Via Fanal
- 1560 Via Botero
- 1668 Avenida Guillermo
- 1664 Avenida Guillermo
- 1499 Enchante Way
- 1289 Via Fanal
- 1309 Via Lucero
- 1291 Via Lucero
- 4668 Calle Del Greco
- 1251 Via Lucero
- 1727 Avenida Vista Labera
- 1175 Via Lucero
- 1185 Via Lucero
- 1194 Via Candelas
- 1372 Toulon St Unit 1
- 1280 Calle Ultimo
- 1615 Corte Verano
- 1613 Calle Las Casas
- 1615 Calle Las Casas
- 1611 Calle Las Casas
- 1617 Calle Las Casas
- 1609 Calle Las Casas
- 4737 Via Escala
- 4753 Via Escala
- 4729 Via Escala
- 1607 Calle Las Casas
- 4761 Via Escala
- 1619 Calle Las Casas
- 4721 Via Escala
- 1624 Calle Las Casas
- 4769 Via Escala
- 1626 Calle Las Casas
- 1605 Calle Las Casas
- 1622 Calle Las Casas
- 4713 Via Escala
- 1621 Calle Las Casas
- 4777 Via Escala
Your Personal Tour Guide
Ask me questions while you tour the home.