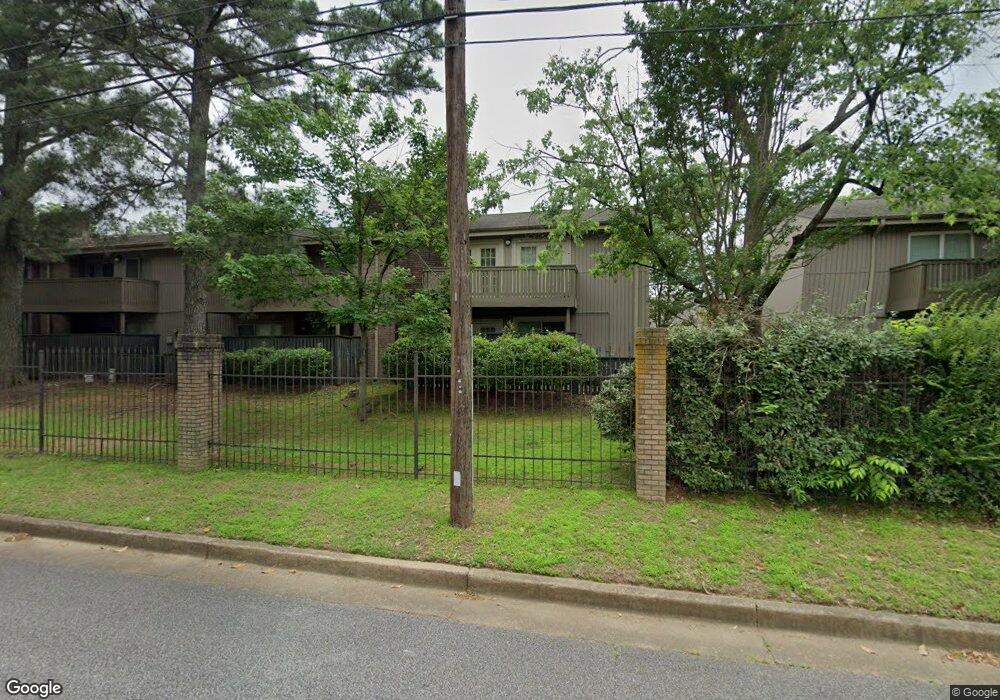
4747 Audubon View Cir Unit 3 Memphis, TN 38117
East Memphis NeighborhoodEstimated Value: $178,000 - $191,388
2
Beds
2
Baths
1,245
Sq Ft
$148/Sq Ft
Est. Value
About This Home
This home is located at 4747 Audubon View Cir Unit 3, Memphis, TN 38117 and is currently estimated at $184,847, approximately $148 per square foot. 4747 Audubon View Cir Unit 3 is a home located in Shelby County with nearby schools including Sea Isle Elementary School, White Station High, and Colonial Middle.
Ownership History
Date
Name
Owned For
Owner Type
Purchase Details
Closed on
May 27, 2022
Sold by
Fountain Collin D
Bought by
Levine Evan P
Current Estimated Value
Home Financials for this Owner
Home Financials are based on the most recent Mortgage that was taken out on this home.
Original Mortgage
$180,000
Outstanding Balance
$170,513
Interest Rate
5.1%
Mortgage Type
New Conventional
Estimated Equity
$14,334
Purchase Details
Closed on
Nov 12, 2021
Sold by
Bethell Michael Clay
Bought by
Fountain Collin D
Purchase Details
Closed on
May 29, 2021
Sold by
Bethell John Bryan
Bought by
Bethell Michael Clay
Purchase Details
Closed on
Nov 30, 1998
Sold by
Osborn Frank D and Bailey Laura Bailey
Bought by
Bethell Nancy N
Home Financials for this Owner
Home Financials are based on the most recent Mortgage that was taken out on this home.
Original Mortgage
$70,900
Interest Rate
6.77%
Mortgage Type
FHA
Create a Home Valuation Report for This Property
The Home Valuation Report is an in-depth analysis detailing your home's value as well as a comparison with similar homes in the area
Home Values in the Area
Average Home Value in this Area
Purchase History
| Date | Buyer | Sale Price | Title Company |
|---|---|---|---|
| Levine Evan P | $240,000 | Executive Title & Closing | |
| Fountain Collin D | $47,000 | None Available | |
| Bethell Michael Clay | -- | None Listed On Document | |
| Bethell Nancy N | $73,000 | -- | |
| Bethell Nancy N | $73,000 | -- |
Source: Public Records
Mortgage History
| Date | Status | Borrower | Loan Amount |
|---|---|---|---|
| Open | Levine Evan P | $180,000 | |
| Previous Owner | Bethell Nancy N | $70,900 |
Source: Public Records
Tax History Compared to Growth
Tax History
| Year | Tax Paid | Tax Assessment Tax Assessment Total Assessment is a certain percentage of the fair market value that is determined by local assessors to be the total taxable value of land and additions on the property. | Land | Improvement |
|---|---|---|---|---|
| 2025 | $1,092 | $49,900 | $3,575 | $46,325 |
| 2024 | $1,092 | $32,200 | $3,575 | $28,625 |
| 2023 | $1,962 | $32,200 | $3,575 | $28,625 |
| 2022 | $1,962 | $32,200 | $3,575 | $28,625 |
| 2021 | $2,331 | $32,200 | $3,575 | $28,625 |
| 2020 | $1,719 | $23,725 | $3,575 | $20,150 |
| 2019 | $758 | $23,725 | $3,575 | $20,150 |
| 2018 | $758 | $23,725 | $3,575 | $20,150 |
| 2017 | $776 | $23,725 | $3,575 | $20,150 |
| 2016 | $994 | $22,750 | $0 | $0 |
| 2014 | $994 | $22,750 | $0 | $0 |
Source: Public Records
Map
Nearby Homes
- 4777 Audubon View Cir Unit 3004
- 4780 Audubon View Cir Unit 3804
- 730 Hedgegrove Dr Unit 4407
- 4776 Audubon View Cir Unit 1
- 809 Merrywood Dr Unit 4
- 726 Hedgegrove Dr Unit 3
- 4764 Eagle Crest Dr Unit 4002
- 812 Creekside Dr Unit 2
- 748 Hedgegrove Dr Unit 4803
- 4779 Eagle Crest Dr Unit 1
- 820 Creekside Dr Unit 1
- 814 Thistledown Dr Unit 1206
- 830 Colonial Rd
- 866 Colonial Rd
- 688 Berry Rd
- 4680 Crossover Ln
- 901 S Perkins Rd
- 663 Moss Rd
- 4614 Perkins Cove
- 883 Drake Manor Cove
- 4747 Audubon View Cir Unit 1503
- 4747 Audubon View Cir Unit 1502
- 4747 Audubon View Cir Unit 1509
- 4747 Audubon View Cir Unit 2
- 4747 Audubon View Cir Unit 1
- 4747 Audubon View Cir Unit 4
- 828 Creekside Dr
- 828 Creekside Dr Unit 2403
- 864 Creekside Dr Unit 2201
- 864 Creekside Dr
- 4771 Eagle Crest Dr
- 4771 Eagle Crest Dr Unit 3906
- 4771 Eagle Crest Dr Unit 4
- 4771 Eagle Crest Dr Unit 3
- 4771 Eagle Crest Dr Unit 2
- 4771 Eagle Crest Dr Unit 1
- 4765 Eagle Crest Dr Unit 4507
- 4765 Eagle Crest Dr Unit 4
- 4765 Eagle Crest Dr Unit 3
- 4765 Eagle Crest Dr Unit 2