Estimated Value: $518,000 - $540,000
6
Beds
4
Baths
3,034
Sq Ft
$176/Sq Ft
Est. Value
About This Home
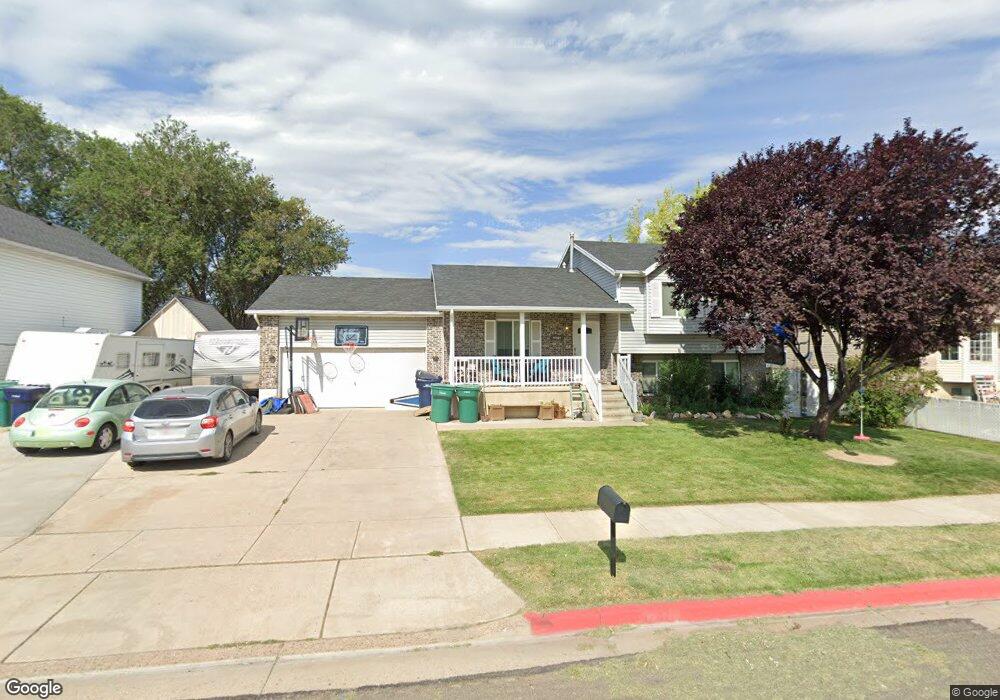
This home is located at 4747 S 2900 W, Roy, UT 84067 and is currently estimated at $532,745, approximately $175 per square foot. 4747 S 2900 W is a home located in Weber County with nearby schools including Midland School, Sand Ridge Junior High School, and Roy High School.
Ownership History
Date
Name
Owned For
Owner Type
Purchase Details
Closed on
Apr 22, 2020
Sold by
Roberts Matthew C
Bought by
Roberts Matthew C and Roberts Kristie
Current Estimated Value
Home Financials for this Owner
Home Financials are based on the most recent Mortgage that was taken out on this home.
Original Mortgage
$273,804
Outstanding Balance
$239,954
Interest Rate
3.3%
Mortgage Type
FHA
Estimated Equity
$292,791
Purchase Details
Closed on
Feb 20, 2017
Sold by
Green Apple Properties V Llc
Bought by
Roberts Matthew C
Home Financials for this Owner
Home Financials are based on the most recent Mortgage that was taken out on this home.
Original Mortgage
$9,975
Interest Rate
4.19%
Mortgage Type
Unknown
Purchase Details
Closed on
Sep 26, 2008
Sold by
Prigmore Robert James and Prigmore Lesley Faye
Bought by
Montague Richard C
Home Financials for this Owner
Home Financials are based on the most recent Mortgage that was taken out on this home.
Original Mortgage
$233,338
Interest Rate
6.49%
Mortgage Type
FHA
Create a Home Valuation Report for This Property
The Home Valuation Report is an in-depth analysis detailing your home's value as well as a comparison with similar homes in the area
Home Values in the Area
Average Home Value in this Area
Purchase History
| Date | Buyer | Sale Price | Title Company |
|---|---|---|---|
| Roberts Matthew C | -- | First American Title Ins Co | |
| Roberts Matthew C | -- | Security Title Ins Agency | |
| Montague Richard C | -- | First American Legend Hills |
Source: Public Records
Mortgage History
| Date | Status | Borrower | Loan Amount |
|---|---|---|---|
| Open | Roberts Matthew C | $273,804 | |
| Closed | Roberts Matthew C | $9,975 | |
| Closed | Roberts Matthew C | $279,837 | |
| Previous Owner | Montague Richard C | $233,338 |
Source: Public Records
Tax History
| Year | Tax Paid | Tax Assessment Tax Assessment Total Assessment is a certain percentage of the fair market value that is determined by local assessors to be the total taxable value of land and additions on the property. | Land | Improvement |
|---|---|---|---|---|
| 2025 | $3,239 | $524,625 | $130,015 | $394,610 |
| 2024 | $3,157 | $283,249 | $71,508 | $211,741 |
| 2023 | $2,947 | $264,000 | $71,317 | $192,683 |
| 2022 | $3,047 | $281,050 | $60,501 | $220,549 |
| 2021 | $1,421 | $200,588 | $75,002 | $125,586 |
| 2020 | $2,330 | $324,000 | $75,002 | $248,998 |
| 2019 | $2,288 | $300,000 | $44,976 | $255,024 |
| 2018 | $2,232 | $276,000 | $44,976 | $231,024 |
| 2017 | $2,138 | $248,000 | $43,029 | $204,971 |
| 2016 | $1,936 | $120,060 | $24,773 | $95,287 |
| 2015 | $1,786 | $113,259 | $24,773 | $88,486 |
| 2014 | $1,802 | $113,259 | $24,773 | $88,486 |
Source: Public Records
Map
Nearby Homes
- 2953 W 4650 S
- 3022 W 4750 S
- 4793 S 3025 W
- 4891 S 2875 W
- 4732 S West Park Dr
- 2817 W 5000 S
- 5009 S 2925 W
- 2602 W 4600 S
- 5063 S 2825 W
- 4374 S 2900 W
- 5141 S 2975 W
- 2581 W 5000 S
- 2815 W 4275 S
- 2979 W 4275 S
- 4510 Stone Creek Rd Unit F
- 4270 S 2900 W
- 4881 S 2400 W
- 4435 Cross Creek Rd Unit 29C
- 5155 S 3200 W
- 5125 S 2600 W
- 4733 S 2900 W
- 4763 S 2900 W
- 4738 S 2950 W
- 4724 S 2950 W
- 4744 S 2950 W
- 4719 S 2900 W
- 4777 S 2900 W
- 4712 S 2950 W Unit 53
- 4712 S 2950 W
- 4756 S 2950 W
- 4705 S 2900 W
- 4704 S 2950 W
- 4791 S 2900 W
- 4727 S 2950 W Unit 52
- 4727 S 2950 W
- 4739 S 2950 W
- 4745 S 2950 W Unit 50
- 4713 S 2950 W
- 4691 S 2900 W
- 2952 W 4700 S
Your Personal Tour Guide
Ask me questions while you tour the home.