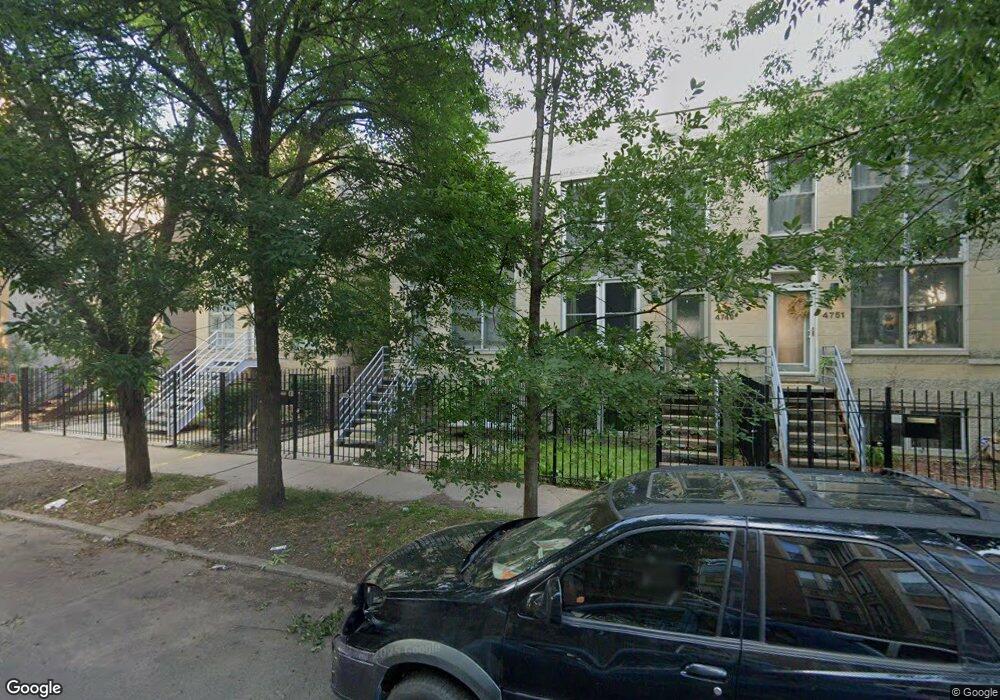
4747 S Ingleside Ave Unit 2 Chicago, IL 60615
Kenwood NeighborhoodEstimated Value: $335,000 - $415,000
3
Beds
3
Baths
1,288
Sq Ft
$287/Sq Ft
Est. Value
About This Home
This home is located at 4747 S Ingleside Ave Unit 2, Chicago, IL 60615 and is currently estimated at $369,343, approximately $286 per square foot. 4747 S Ingleside Ave Unit 2 is a home located in Cook County with nearby schools including Reavis Elementary Math & Science Specialty School, Kenwood Academy High School, and The UChicago Charter School - North Kenwood/Oakland.
Ownership History
Date
Name
Owned For
Owner Type
Purchase Details
Closed on
Dec 31, 2015
Sold by
Rich Brian
Bought by
Rich Adrienne May
Current Estimated Value
Home Financials for this Owner
Home Financials are based on the most recent Mortgage that was taken out on this home.
Original Mortgage
$139,330
Outstanding Balance
$109,658
Interest Rate
3.97%
Mortgage Type
Stand Alone First
Estimated Equity
$259,685
Purchase Details
Closed on
Oct 4, 2011
Sold by
Bmo Harris Bank Na
Bought by
Rich Brian and Rich Adrienne
Purchase Details
Closed on
May 26, 2004
Sold by
Rich Brian and Rich Adrienne May
Bought by
Oak Brook Bank and Trust #4003
Purchase Details
Closed on
Jun 28, 1996
Sold by
American National Bk & Tr Co Of Chicago
Bought by
Rich Brian and May Adrienne G
Home Financials for this Owner
Home Financials are based on the most recent Mortgage that was taken out on this home.
Original Mortgage
$171,000
Interest Rate
8.33%
Create a Home Valuation Report for This Property
The Home Valuation Report is an in-depth analysis detailing your home's value as well as a comparison with similar homes in the area
Home Values in the Area
Average Home Value in this Area
Purchase History
| Date | Buyer | Sale Price | Title Company |
|---|---|---|---|
| Rich Adrienne May | -- | First American Title | |
| Rich Brian | -- | Attorney | |
| Oak Brook Bank | -- | -- | |
| Rich Brian | $180,000 | -- |
Source: Public Records
Mortgage History
| Date | Status | Borrower | Loan Amount |
|---|---|---|---|
| Open | Rich Adrienne May | $139,330 | |
| Previous Owner | Rich Brian | $171,000 |
Source: Public Records
Tax History
| Year | Tax Paid | Tax Assessment Tax Assessment Total Assessment is a certain percentage of the fair market value that is determined by local assessors to be the total taxable value of land and additions on the property. | Land | Improvement |
|---|---|---|---|---|
| 2025 | $6,709 | $39,000 | $12,338 | $26,662 |
| 2024 | $6,709 | $39,000 | $12,338 | $26,662 |
| 2023 | $6,495 | $35,000 | $9,950 | $25,050 |
| 2022 | $6,495 | $35,000 | $9,950 | $25,050 |
| 2021 | $6,369 | $35,000 | $9,950 | $25,050 |
| 2020 | $7,005 | $34,547 | $7,960 | $26,587 |
| 2019 | $6,856 | $37,552 | $7,960 | $29,592 |
| 2018 | $7,062 | $39,184 | $7,960 | $31,224 |
| 2017 | $6,638 | $34,209 | $6,567 | $27,642 |
| 2016 | $6,352 | $34,209 | $6,567 | $27,642 |
| 2015 | $5,788 | $34,209 | $6,567 | $27,642 |
| 2014 | $4,156 | $24,968 | $5,373 | $19,595 |
| 2013 | $4,063 | $24,968 | $5,373 | $19,595 |
Source: Public Records
Map
Nearby Homes
- 4740 S Ingleside Ave Unit 2N
- 4721 S Ingleside Ave
- 829 E 48th St Unit D
- 4730 S Greenwood Ave
- 835 E 49th St Unit 3
- 1034 E 47th St Unit 1W
- 4959 S Greenwood Ave
- 928 E 46th St
- 4553 S Ellis Ave
- 1024 E 46th St Unit 2W
- 4732 S Evans Ave
- 4721 S Woodlawn Ave Unit E
- 4537 S Drexel Blvd Unit 503
- 4529 S Drexel Blvd Unit 452912
- 4527 S Drexel Blvd Unit 1W
- 4701 S Woodlawn Ave
- 4525 S Drexel Blvd Unit 3W
- 4933 S Woodlawn Ave
- 5052 S Drexel Blvd Unit 3C
- 1151 E 46th St
- 4749 S Ingleside Ave
- 4745 S Ingleside Ave
- 4751 S Ingleside Ave
- 4751 S Ingleside Ave
- 4751 S Ingleside Ave
- 4743 S Ingleside Ave
- 4753 S Ingleside Ave
- 4737 S Ingleside Ave
- 934 E 48th St
- 932 E 48th St
- 930 E 48th St
- 930 E 48th St Unit 1
- 936 E 48th St
- 4742 S Ellis Ave Unit 3
- 4742 S Ellis Ave Unit 2
- 4742 S Ellis Ave Unit 1
- 922 E 48th St
- 4742 S Ingleside Ave Unit 1
- 4742 S Ingleside Ave Unit 3S
- 4742 S Ingleside Ave Unit 2
Your Personal Tour Guide
Ask me questions while you tour the home.