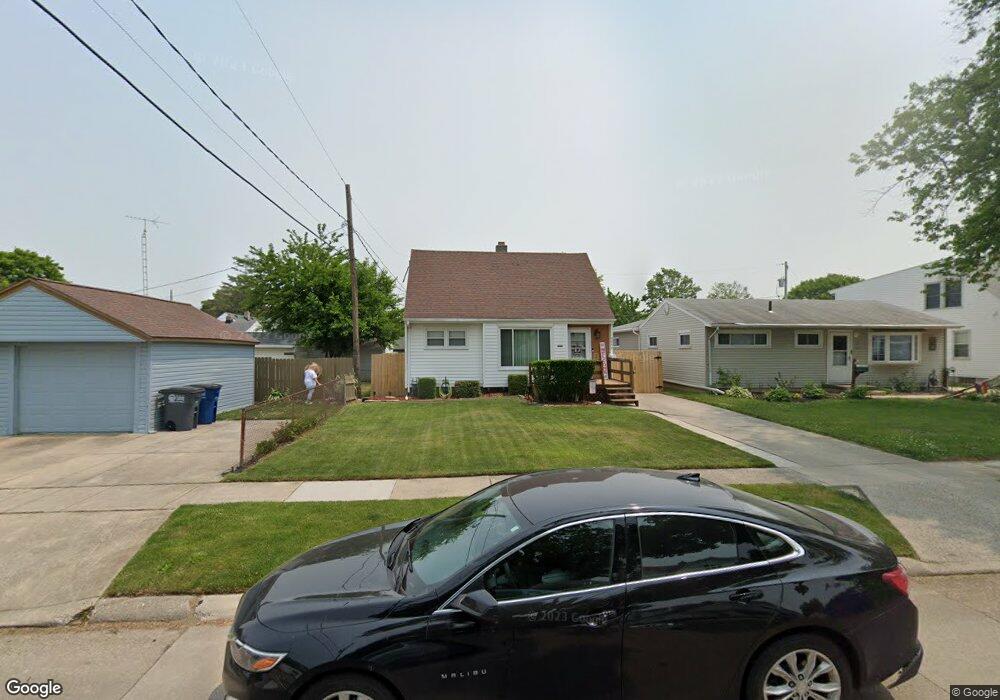
4748 285th St Toledo, OH 43611
Point Place NeighborhoodEstimated Value: $130,000 - $169,000
4
Beds
1
Bath
902
Sq Ft
$160/Sq Ft
Est. Value
About This Home
This home is located at 4748 285th St, Toledo, OH 43611 and is currently estimated at $144,523, approximately $160 per square foot. 4748 285th St is a home located in Lucas County with nearby schools including Ottawa River Elementary School, Woodward High School, and Imagine Environmental Science Academy.
Ownership History
Date
Name
Owned For
Owner Type
Purchase Details
Closed on
Oct 26, 2021
Sold by
Gruhler Dennis D and Gruhler Nancy V
Bought by
Dile John M and Dile Angela J
Current Estimated Value
Home Financials for this Owner
Home Financials are based on the most recent Mortgage that was taken out on this home.
Original Mortgage
$90,155
Outstanding Balance
$82,391
Interest Rate
2.8%
Mortgage Type
New Conventional
Estimated Equity
$62,132
Purchase Details
Closed on
Oct 23, 2020
Sold by
Gruhler Dennis and Gruhler Nancy
Bought by
Gruhler Dennis D and Gruhler Nancy V
Purchase Details
Closed on
Jan 29, 2003
Sold by
Gruhler Dennis and Gruhler Nancy
Bought by
Gruhler Dennis and Gruhler Nancy
Purchase Details
Closed on
Dec 24, 2002
Sold by
Estate Of Edward R Fisher
Bought by
Gruhler Dennis
Create a Home Valuation Report for This Property
The Home Valuation Report is an in-depth analysis detailing your home's value as well as a comparison with similar homes in the area
Home Values in the Area
Average Home Value in this Area
Purchase History
| Date | Buyer | Sale Price | Title Company |
|---|---|---|---|
| Dile John M | $94,900 | None Available | |
| Gruhler Dennis D | -- | None Available | |
| Gruhler Dennis | -- | -- | |
| Gruhler Dennis | -- | -- |
Source: Public Records
Mortgage History
| Date | Status | Borrower | Loan Amount |
|---|---|---|---|
| Open | Dile John M | $90,155 |
Source: Public Records
Tax History Compared to Growth
Tax History
| Year | Tax Paid | Tax Assessment Tax Assessment Total Assessment is a certain percentage of the fair market value that is determined by local assessors to be the total taxable value of land and additions on the property. | Land | Improvement |
|---|---|---|---|---|
| 2024 | $912 | $29,785 | $8,225 | $21,560 |
| 2023 | $1,471 | $22,750 | $7,070 | $15,680 |
| 2022 | $1,473 | $22,750 | $7,070 | $15,680 |
| 2021 | $1,540 | $22,750 | $7,070 | $15,680 |
| 2020 | $1,443 | $18,690 | $5,810 | $12,880 |
| 2019 | $1,404 | $18,690 | $5,810 | $12,880 |
| 2018 | $1,415 | $18,690 | $5,810 | $12,880 |
| 2017 | $1,433 | $18,095 | $5,320 | $12,775 |
| 2016 | $1,433 | $51,700 | $15,200 | $36,500 |
| 2015 | $1,421 | $51,700 | $15,200 | $36,500 |
| 2014 | $1,170 | $18,100 | $5,320 | $12,780 |
| 2013 | $1,170 | $18,100 | $5,320 | $12,780 |
Source: Public Records
Map
Nearby Homes
- 4828 287th St
- 4492 283rd St
- 2532 102nd St
- 4441 290th St
- 2240 Ruthanne Dr
- 4811 298th St
- 4314 Dahlia Dr
- 2641 117th St
- 2730 109th St
- 4252 289th St
- 2434 Roseann Dr
- 4755 301st St
- 5331 Whitehouse Dr
- 5504 Ketukkee Trail
- 2849 N 109th St
- 2642 124th St
- 2819 117th St
- 5454 Brook Point Rd
- 5534 Suder Ave
- 5433 Brophy Dr