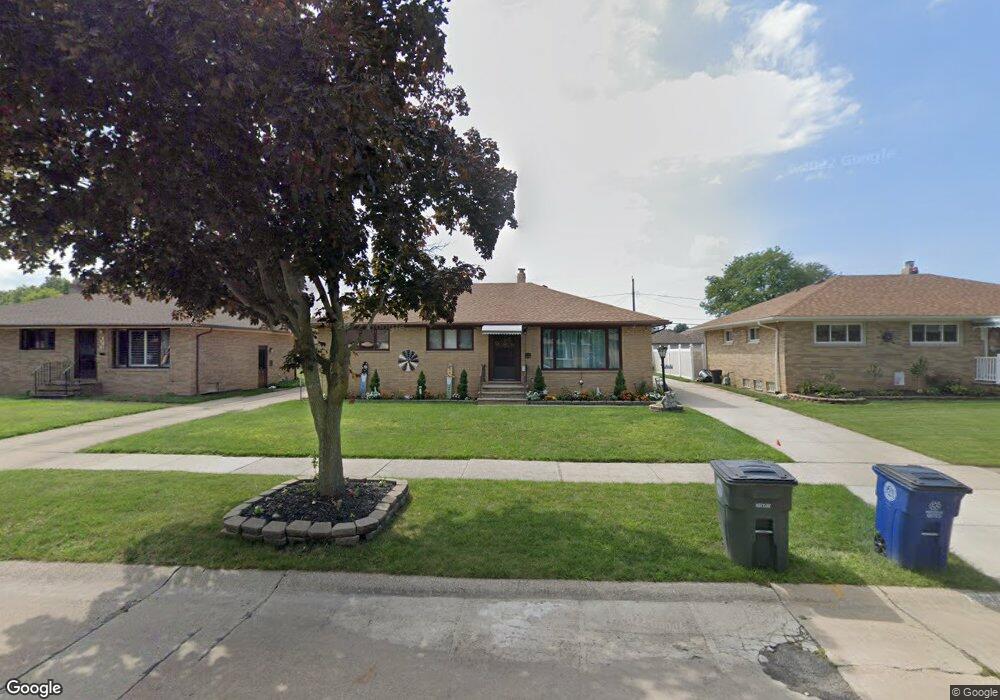
4748 Forest Edge Dr Cleveland, OH 44144
Estimated Value: $232,000 - $262,000
3
Beds
2
Baths
1,290
Sq Ft
$188/Sq Ft
Est. Value
About This Home
This home is located at 4748 Forest Edge Dr, Cleveland, OH 44144 and is currently estimated at $242,813, approximately $188 per square foot. 4748 Forest Edge Dr is a home located in Cuyahoga County with nearby schools including Brooklyn Elementary School, Brooklyn High School, and Cleveland Preparatory Academy.
Ownership History
Date
Name
Owned For
Owner Type
Purchase Details
Closed on
Oct 10, 2012
Sold by
Cramer Kim
Bought by
Cramer James D
Current Estimated Value
Purchase Details
Closed on
Aug 20, 2012
Sold by
Cramer Frank
Bought by
Cramer Kim
Purchase Details
Closed on
Aug 2, 2012
Sold by
Estate Of Francis E Cramer
Bought by
Carmer Frank and Cramer Kim
Purchase Details
Closed on
Oct 29, 2005
Sold by
Wade Kelly
Bought by
Cramer Francis E
Home Financials for this Owner
Home Financials are based on the most recent Mortgage that was taken out on this home.
Original Mortgage
$75,000
Interest Rate
5.41%
Mortgage Type
Purchase Money Mortgage
Purchase Details
Closed on
Nov 1, 1983
Sold by
Grilli Sam
Bought by
Konarski Chester A
Purchase Details
Closed on
Nov 12, 1981
Sold by
Grilli Sam and Grilli Mary
Bought by
Grilli Sam
Purchase Details
Closed on
Jan 1, 1975
Bought by
Grilli Sam and Grilli Mary
Create a Home Valuation Report for This Property
The Home Valuation Report is an in-depth analysis detailing your home's value as well as a comparison with similar homes in the area
Home Values in the Area
Average Home Value in this Area
Purchase History
| Date | Buyer | Sale Price | Title Company |
|---|---|---|---|
| Cramer James D | -- | None Available | |
| Cramer Kim | -- | Attorney | |
| Carmer Frank | -- | Attorney | |
| Cramer Francis E | $143,000 | Premier Title Agency Ltd | |
| Konarski Chester A | $79,000 | -- | |
| Grilli Sam | -- | -- | |
| Grilli Sam | -- | -- |
Source: Public Records
Mortgage History
| Date | Status | Borrower | Loan Amount |
|---|---|---|---|
| Previous Owner | Cramer Francis E | $75,000 |
Source: Public Records
Tax History Compared to Growth
Tax History
| Year | Tax Paid | Tax Assessment Tax Assessment Total Assessment is a certain percentage of the fair market value that is determined by local assessors to be the total taxable value of land and additions on the property. | Land | Improvement |
|---|---|---|---|---|
| 2024 | $5,034 | $72,415 | $14,280 | $58,135 |
| 2023 | $3,853 | $51,070 | $10,570 | $40,500 |
| 2022 | $3,820 | $51,070 | $10,570 | $40,500 |
| 2021 | $3,885 | $51,070 | $10,570 | $40,500 |
| 2020 | $3,634 | $43,650 | $9,030 | $34,620 |
| 2019 | $3,567 | $124,700 | $25,800 | $98,900 |
| 2018 | $3,279 | $43,650 | $9,030 | $34,620 |
| 2017 | $2,889 | $35,880 | $7,700 | $28,180 |
| 2016 | $2,884 | $35,880 | $7,700 | $28,180 |
| 2015 | $2,817 | $35,880 | $7,700 | $28,180 |
| 2014 | $2,817 | $35,180 | $7,560 | $27,620 |
Source: Public Records
Map
Nearby Homes
- 4722 Bentwood Dr
- 4830 Autumn Ln
- 4574 Bentwood Dr
- 4728 Summer Ln
- 8906 Behrwald Ave
- 9909 Richard Dr
- 9912 Richard Dr
- 9416 Behrwald Ave
- 9005 Ansonia Ave
- 4451 Roadoan Rd
- 4444 Roadoan Rd
- 9005 Orchard Ave
- 4739 Ridge Rd
- 9304 Torrance Ave
- 9416 Outlook Dr
- 6508 Delora Ave
- 9739 Memphis Villas Blvd
- 6209 Archmere Ave
- 9756 Memphis Villas Blvd
- 7420 Outlook Ave
- 4752 Forest Edge Dr
- 4744 Forest Edge Dr
- 4749 Bentwood Dr
- 4740 Forest Edge Dr
- 4756 Forest Edge Dr
- 4753 Bentwood Dr
- 4745 Bentwood Dr
- 4743 Bentwood Dr
- 4757 Bentwood Dr
- 4747 Forest Edge Dr
- 4736 Forest Edge Dr
- 4760 Forest Edge Dr
- 4751 Forest Edge Dr
- 4743 Forest Edge Dr
- 4739 Bentwood Dr
- 4739 Forest Edge Dr
- 4755 Forest Edge Dr
- 4761 Bentwood Dr
- 4732 Forest Edge Dr
- 4764 Forest Edge Dr