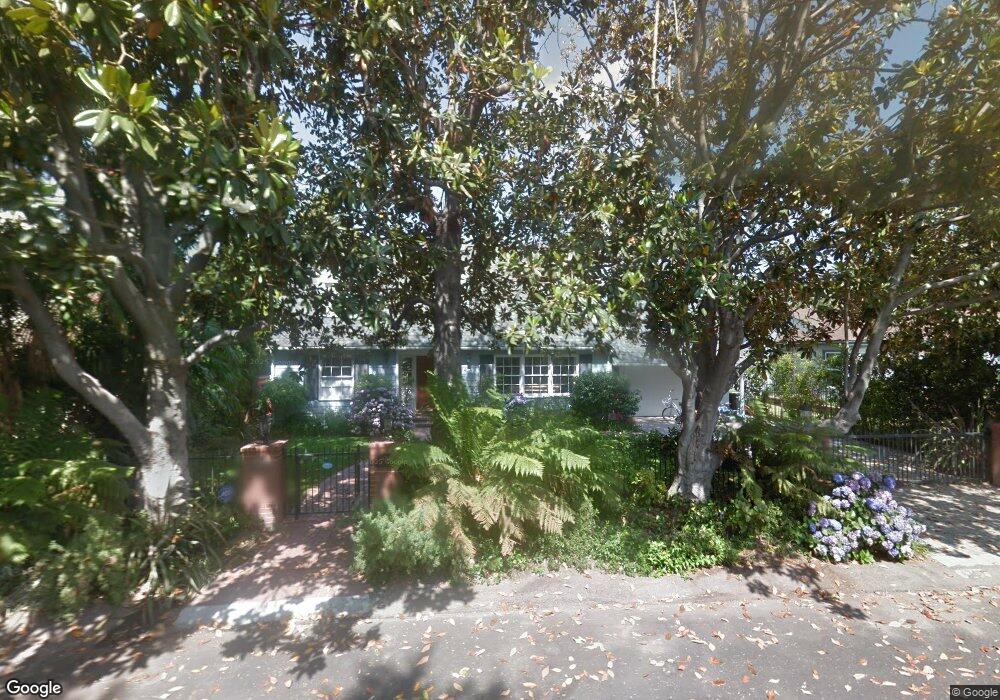
4749 Arcola Ave Toluca Lake, CA 91602
Estimated Value: $2,172,000 - $2,302,000
3
Beds
3
Baths
2,342
Sq Ft
$954/Sq Ft
Est. Value
About This Home
This home is located at 4749 Arcola Ave, Toluca Lake, CA 91602 and is currently estimated at $2,235,186, approximately $954 per square foot. 4749 Arcola Ave is a home located in Los Angeles County with nearby schools including Toluca Lake Elementary School, Walter Reed Middle, and East Valley Senior High School.
Ownership History
Date
Name
Owned For
Owner Type
Purchase Details
Closed on
Nov 5, 2017
Sold by
Kehrli Todd
Bought by
Kehrli Todd Marshall and Kehrli Cherilynn Marie
Current Estimated Value
Purchase Details
Closed on
Oct 12, 2004
Sold by
Co Everett A
Bought by
Kehrli Todd and Kehrli Cherilynn
Home Financials for this Owner
Home Financials are based on the most recent Mortgage that was taken out on this home.
Original Mortgage
$712,000
Outstanding Balance
$351,435
Interest Rate
5.72%
Mortgage Type
Purchase Money Mortgage
Estimated Equity
$1,883,751
Purchase Details
Closed on
Sep 20, 1996
Sold by
Lower Robert Tr Julia F Fetzer Trust
Bought by
Co Everett A and Co Sheryl J
Home Financials for this Owner
Home Financials are based on the most recent Mortgage that was taken out on this home.
Original Mortgage
$306,000
Interest Rate
8.3%
Purchase Details
Closed on
Mar 9, 1994
Sold by
Fetzer Julia Frances
Bought by
Lower Robert
Create a Home Valuation Report for This Property
The Home Valuation Report is an in-depth analysis detailing your home's value as well as a comparison with similar homes in the area
Home Values in the Area
Average Home Value in this Area
Purchase History
| Date | Buyer | Sale Price | Title Company |
|---|---|---|---|
| Kehrli Todd Marshall | -- | None Available | |
| Kehrli Todd | $890,000 | Equity Title Company | |
| Co Everett A | $340,000 | -- | |
| Lower Robert | -- | -- |
Source: Public Records
Mortgage History
| Date | Status | Borrower | Loan Amount |
|---|---|---|---|
| Open | Kehrli Todd | $712,000 | |
| Previous Owner | Co Everett A | $306,000 |
Source: Public Records
Tax History Compared to Growth
Tax History
| Year | Tax Paid | Tax Assessment Tax Assessment Total Assessment is a certain percentage of the fair market value that is determined by local assessors to be the total taxable value of land and additions on the property. | Land | Improvement |
|---|---|---|---|---|
| 2025 | $15,543 | $1,289,074 | $823,796 | $465,278 |
| 2024 | $15,543 | $1,263,799 | $807,644 | $456,155 |
| 2023 | $15,242 | $1,239,019 | $791,808 | $447,211 |
| 2022 | $14,532 | $1,214,726 | $776,283 | $438,443 |
| 2021 | $14,351 | $1,190,909 | $761,062 | $429,847 |
| 2019 | $13,921 | $1,155,589 | $738,490 | $417,099 |
| 2018 | $13,810 | $1,132,931 | $724,010 | $408,921 |
| 2017 | $13,507 | $1,110,717 | $709,814 | $400,903 |
| 2016 | $12,855 | $1,060,660 | $695,897 | $364,763 |
| 2015 | $12,372 | $1,020,000 | $668,000 | $352,000 |
| 2014 | $12,072 | $972,000 | $637,000 | $335,000 |
Source: Public Records
Map
Nearby Homes
- 10240 Camarillo St Unit 204
- 10240 Camarillo St Unit 301
- 4831 Sancola Ave
- 4645 Ledge Ave
- 4940 Arcola Ave
- 4949 Sancola Ave
- 4547 Ledge Ave
- 4544 Talofa Ave
- 10409 Riverside Dr Unit 203
- 10352 Riverside Dr Unit 102
- 10352 Riverside Dr Unit 201
- 4433 Arcola Ave
- 10458 Riverside Dr
- 4427 Arcola Ave
- 906 N Ford St
- 4231 W Sarah St Unit 15
- 4910 Willowcrest Ave
- 4402 Ledge Ave
- 4426 Auckland Ave
- 10707 Camarillo St Unit 206
- 4757 Arcola Ave
- 4741 Arcola Ave
- 4748 Placidia Ave
- 4733 Arcola Ave
- 4756 Placidia Ave
- 4740 Placidia Ave
- 4732 Placidia Ave
- 4740 Arcola Ave
- 4805 Arcola Ave
- 4727 Arcola Ave
- 4732 Arcola Ave
- 10321 Camarillo St
- 4726 Placidia Ave
- 4809 Arcola Ave
- 10261 Camarillo St
- 4806 Placidia Ave
- 4724 Arcola Ave
- 10257 Camarillo St
- 4718 Placidia Ave
- 4751 Placidia Ave