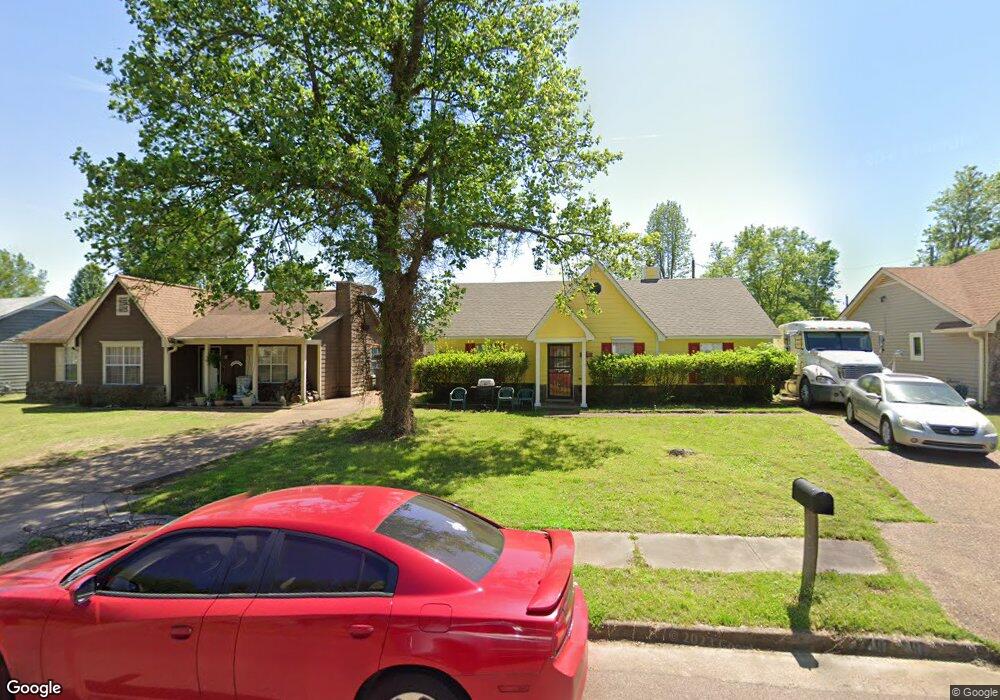
4749 Crestfield Rd Millington, TN 38053
Estimated Value: $167,000 - $187,000
3
Beds
2
Baths
1,206
Sq Ft
$148/Sq Ft
Est. Value
About This Home
This home is located at 4749 Crestfield Rd, Millington, TN 38053 and is currently estimated at $178,898, approximately $148 per square foot. 4749 Crestfield Rd is a home located in Shelby County with nearby schools including Lucy Elementary School, Woodstock Middle School, and Bolton High School.
Ownership History
Date
Name
Owned For
Owner Type
Purchase Details
Closed on
Sep 14, 2021
Sold by
Porter Lolina and Porter Brett Martin
Bought by
Porter Lolina Moran and Porter Brett Martin
Current Estimated Value
Purchase Details
Closed on
Jul 25, 2006
Sold by
Turner James Ronnie
Bought by
Porter Lolina
Home Financials for this Owner
Home Financials are based on the most recent Mortgage that was taken out on this home.
Original Mortgage
$83,600
Outstanding Balance
$57,991
Interest Rate
9.95%
Mortgage Type
Purchase Money Mortgage
Estimated Equity
$120,907
Purchase Details
Closed on
Sep 28, 1998
Sold by
Smith Melissa D and Smith Howard K
Bought by
Turner James Ronnie
Home Financials for this Owner
Home Financials are based on the most recent Mortgage that was taken out on this home.
Original Mortgage
$72,550
Interest Rate
6.92%
Mortgage Type
FHA
Create a Home Valuation Report for This Property
The Home Valuation Report is an in-depth analysis detailing your home's value as well as a comparison with similar homes in the area
Home Values in the Area
Average Home Value in this Area
Purchase History
| Date | Buyer | Sale Price | Title Company |
|---|---|---|---|
| Porter Lolina Moran | -- | None Available | |
| Porter Lolina | $92,900 | None Available | |
| Turner James Ronnie | $71,500 | Stewart Title Company |
Source: Public Records
Mortgage History
| Date | Status | Borrower | Loan Amount |
|---|---|---|---|
| Open | Porter Lolina | $83,600 | |
| Previous Owner | Turner James Ronnie | $72,550 |
Source: Public Records
Tax History Compared to Growth
Tax History
| Year | Tax Paid | Tax Assessment Tax Assessment Total Assessment is a certain percentage of the fair market value that is determined by local assessors to be the total taxable value of land and additions on the property. | Land | Improvement |
|---|---|---|---|---|
| 2025 | $955 | $42,225 | $5,000 | $37,225 |
| 2024 | $955 | $28,175 | $3,725 | $24,450 |
| 2023 | $955 | $28,175 | $3,725 | $24,450 |
| 2022 | $955 | $28,175 | $3,725 | $24,450 |
| 2021 | $972 | $28,175 | $3,725 | $24,450 |
| 2020 | $791 | $19,525 | $3,725 | $15,800 |
| 2019 | $791 | $19,525 | $3,725 | $15,800 |
| 2018 | $791 | $19,525 | $3,725 | $15,800 |
| 2017 | $802 | $19,525 | $3,725 | $15,800 |
| 2016 | $801 | $18,325 | $0 | $0 |
| 2014 | $801 | $18,325 | $0 | $0 |
Source: Public Records
Map
Nearby Homes
- 4551 Waverly Farms Rd
- 5975 Prairie Cove
- 4392 Ridge Bay Cove
- 4428 Duncan Rd
- 4385 Ridge Bay Cove
- 6866 Basun Cir E
- 4578 Basun Cir E
- 4140 Pleasant Ridge Rd
- 4600 Goldsby Place
- 4235 Sykes Rd
- 4703 Cedar Rose Dr
- 4537 Basun Cir S
- 7011 Alder Wood Dr
- 7266 Raleigh Millington Rd
- 3545 Lucy Rd
- 4315 Peach Run Lane Ln
- 4288 Peach Run Lane Ln
- 4917 Hallbrook Dr
- 4302 Peach Run Lane Ln
- 4306 Peach Run Ln
- 4743 Crestfield Rd
- 4755 Crestfield Rd
- 6014 Almond Creek Cove
- 4765 Crestfield Rd
- 6011 Almond Creek Cove
- 4733 Crestfield Rd
- 6048 Chadwell Rd
- 4750 Crestfield Rd
- 4744 Crestfield Rd
- 4756 Crestfield Rd
- 4775 Crestfield Rd
- 6008 Almond Creek Cove
- 4738 Crestfield Rd
- 6042 Chadwell Rd
- 4762 Crestfield Rd
- 4732 Crestfield Rd
- 4785 Crestfield Rd
- 6003 Almond Creek Cove
- 4770 Crestfield Rd
- 4795 Crestfield Rd