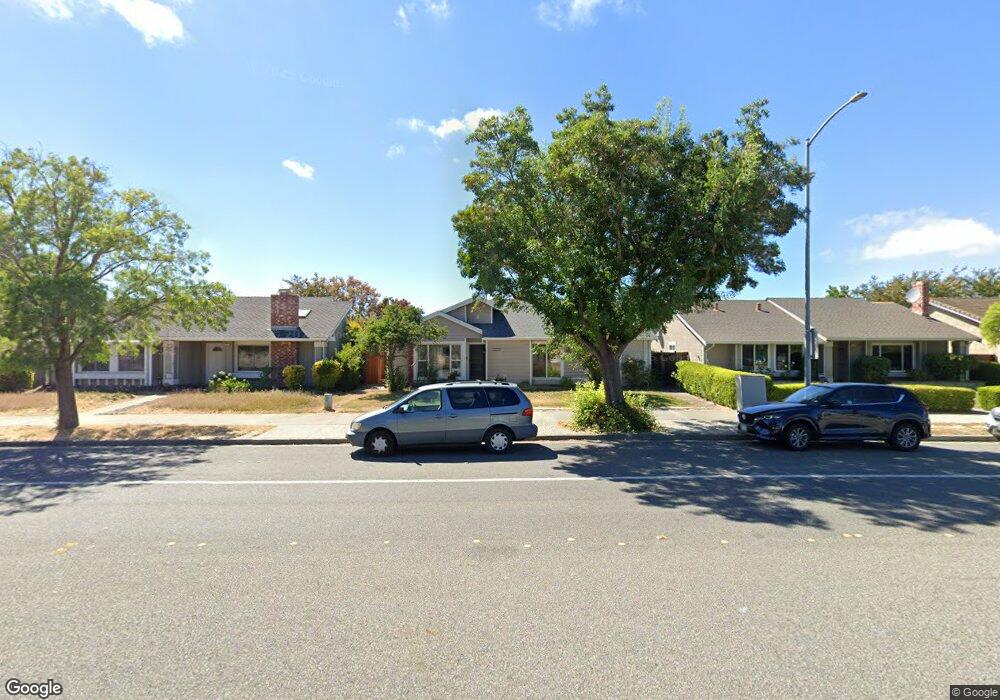
4749 Deep Creek Rd Fremont, CA 94555
Ardenwood NeighborhoodEstimated Value: $1,553,943 - $1,850,000
4
Beds
2
Baths
1,693
Sq Ft
$1,003/Sq Ft
Est. Value
About This Home
This home is located at 4749 Deep Creek Rd, Fremont, CA 94555 and is currently estimated at $1,697,986, approximately $1,002 per square foot. 4749 Deep Creek Rd is a home located in Alameda County with nearby schools including Ardenwood Elementary, Thornton Middle School, and American High School.
Ownership History
Date
Name
Owned For
Owner Type
Purchase Details
Closed on
Aug 7, 2014
Sold by
Erva Srivinasulu and Erva Hemalatha
Bought by
The Erva Family Revocable Trust
Current Estimated Value
Purchase Details
Closed on
Jul 17, 2000
Sold by
Pham Huong and Nguyen Kim T
Bought by
Erva Srinivasulu and Erva Hemalatha
Home Financials for this Owner
Home Financials are based on the most recent Mortgage that was taken out on this home.
Original Mortgage
$356,000
Outstanding Balance
$127,569
Interest Rate
8.25%
Estimated Equity
$1,570,417
Purchase Details
Closed on
Nov 5, 1997
Sold by
Feng James Y
Bought by
Pham Huong and Nguyen Loan Kim Thi
Home Financials for this Owner
Home Financials are based on the most recent Mortgage that was taken out on this home.
Original Mortgage
$204,000
Interest Rate
7.3%
Create a Home Valuation Report for This Property
The Home Valuation Report is an in-depth analysis detailing your home's value as well as a comparison with similar homes in the area
Home Values in the Area
Average Home Value in this Area
Purchase History
| Date | Buyer | Sale Price | Title Company |
|---|---|---|---|
| The Erva Family Revocable Trust | -- | None Available | |
| Erva Srinivasulu | $445,000 | -- | |
| Pham Huong | $255,000 | Old Republic Title Company |
Source: Public Records
Mortgage History
| Date | Status | Borrower | Loan Amount |
|---|---|---|---|
| Open | Erva Srinivasulu | $356,000 | |
| Previous Owner | Pham Huong | $204,000 | |
| Closed | Erva Srinivasulu | $44,500 |
Source: Public Records
Tax History Compared to Growth
Tax History
| Year | Tax Paid | Tax Assessment Tax Assessment Total Assessment is a certain percentage of the fair market value that is determined by local assessors to be the total taxable value of land and additions on the property. | Land | Improvement |
|---|---|---|---|---|
| 2025 | $8,188 | $663,494 | $201,148 | $469,346 |
| 2024 | $8,188 | $650,348 | $197,204 | $460,144 |
| 2023 | $7,963 | $644,461 | $193,338 | $451,123 |
| 2022 | $7,853 | $624,828 | $189,548 | $442,280 |
| 2021 | $7,661 | $612,440 | $185,832 | $433,608 |
| 2020 | $7,660 | $613,088 | $183,926 | $429,162 |
| 2019 | $7,573 | $601,070 | $180,321 | $420,749 |
| 2018 | $7,423 | $589,286 | $176,786 | $412,500 |
| 2017 | $7,237 | $577,734 | $173,320 | $404,414 |
| 2016 | $7,110 | $566,408 | $169,922 | $396,486 |
| 2015 | $7,012 | $557,904 | $167,371 | $390,533 |
| 2014 | $6,888 | $546,980 | $164,094 | $382,886 |
Source: Public Records
Map
Nearby Homes
- 4512 Macbeth Ave
- 4744 Touchstone Terrace
- 4141 Deep Creek Rd Unit 137
- 5301 Shamrock Common
- 4243 Nerissa Cir
- 34102 Zaner Way
- 32945 Regents Blvd
- 33018 Soquel St
- 34648 Musk Terrace
- 4272 Warbler Loop
- 34198 Tony Terrace
- 34565 Pueblo Terrace
- 34607 Pueblo Terrace
- 34627 Pueblo Terrace
- 5220 Fairbanks Common
- 3851 Milton Terrace
- 3840 Springfield Common
- 5176 Tacoma Common
- 34768 Swain Common
- 5308 Tacoma Common
- 4761 Deep Creek Rd
- 4737 Deep Creek Rd
- 4750 Falstaff Ave
- 4760 Falstaff Ave
- 4773 Deep Creek Rd
- 4725 Deep Creek Rd
- 4740 Falstaff Ave
- 4730 Falstaff Ave
- 4785 Deep Creek Rd
- 4713 Deep Creek Rd
- 33448 Bardolph Cir
- 4736 Deep Creek Rd
- 4720 Falstaff Ave
- 4724 Deep Creek Rd
- 4797 Deep Creek Rd
- 4748 Deep Creek Rd
- 33461 Bardolph Cir
- 33454 Bardolph Cir
- 33825 Capulet Cir
- 4712 Deep Creek Rd