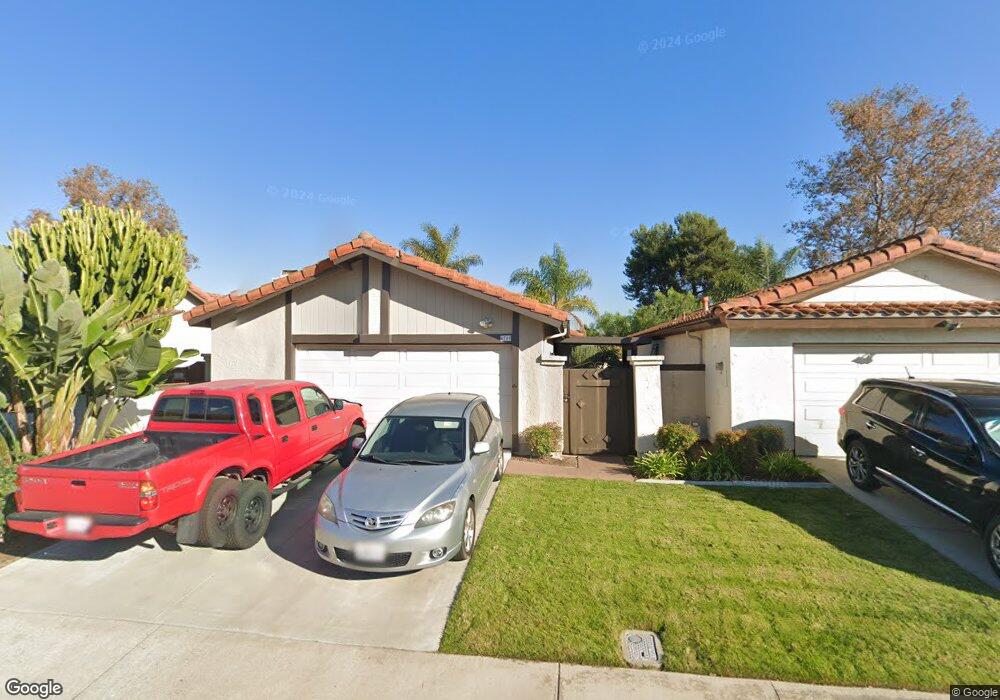
4749 Sequoia Place Oceanside, CA 92057
San Luis Rey NeighborhoodEstimated Value: $662,458 - $714,000
3
Beds
2
Baths
1,006
Sq Ft
$695/Sq Ft
Est. Value
About This Home
This home is located at 4749 Sequoia Place, Oceanside, CA 92057 and is currently estimated at $699,365, approximately $695 per square foot. 4749 Sequoia Place is a home located in San Diego County with nearby schools including Del Rio Elementary School, Cesar Chavez Middle School, and El Camino High School.
Ownership History
Date
Name
Owned For
Owner Type
Purchase Details
Closed on
Jul 23, 2004
Sold by
Murphy Kevin F and Murphy Linda S
Bought by
Murphy Kevin F and Murphy Linda S
Current Estimated Value
Purchase Details
Closed on
Jul 20, 1999
Sold by
Va
Bought by
Murphy Kevin F and Murphy Linda S
Home Financials for this Owner
Home Financials are based on the most recent Mortgage that was taken out on this home.
Original Mortgage
$126,875
Outstanding Balance
$35,764
Interest Rate
7.64%
Mortgage Type
Seller Take Back
Estimated Equity
$663,601
Purchase Details
Closed on
Oct 15, 1998
Sold by
Chase Manhattan Mtg Corp
Bought by
Va
Purchase Details
Closed on
Oct 8, 1998
Sold by
Kennedy Anthony Q
Bought by
Chase Manhattan Mtg Corp
Purchase Details
Closed on
Jul 15, 1994
Sold by
Mayeda Cynthia
Bought by
Kennedy Anthony Q
Home Financials for this Owner
Home Financials are based on the most recent Mortgage that was taken out on this home.
Original Mortgage
$118,830
Interest Rate
8.8%
Mortgage Type
VA
Purchase Details
Closed on
Sep 20, 1985
Create a Home Valuation Report for This Property
The Home Valuation Report is an in-depth analysis detailing your home's value as well as a comparison with similar homes in the area
Home Values in the Area
Average Home Value in this Area
Purchase History
| Date | Buyer | Sale Price | Title Company |
|---|---|---|---|
| Murphy Kevin F | -- | -- | |
| Murphy Kevin F | $130,000 | Northern Counties Title | |
| Va | -- | Landsafe Title | |
| Chase Manhattan Mtg Corp | $110,119 | Landsafe Title | |
| Kennedy Anthony Q | $116,500 | Commonwealth Land Title Co | |
| -- | $78,800 | -- |
Source: Public Records
Mortgage History
| Date | Status | Borrower | Loan Amount |
|---|---|---|---|
| Open | Murphy Kevin F | $126,875 | |
| Previous Owner | Kennedy Anthony Q | $118,830 |
Source: Public Records
Tax History
| Year | Tax Paid | Tax Assessment Tax Assessment Total Assessment is a certain percentage of the fair market value that is determined by local assessors to be the total taxable value of land and additions on the property. | Land | Improvement |
|---|---|---|---|---|
| 2025 | $2,233 | $199,011 | $55,548 | $143,463 |
| 2024 | $2,233 | $195,109 | $54,459 | $140,650 |
| 2023 | $2,164 | $191,285 | $53,392 | $137,893 |
| 2022 | $2,131 | $187,536 | $52,346 | $135,190 |
| 2021 | $2,140 | $183,860 | $51,320 | $132,540 |
| 2020 | $2,074 | $181,975 | $50,794 | $131,181 |
| 2019 | $2,015 | $178,408 | $49,799 | $128,609 |
| 2018 | $1,994 | $174,911 | $48,823 | $126,088 |
| 2017 | $1,958 | $171,482 | $47,866 | $123,616 |
| 2016 | $1,894 | $168,121 | $46,928 | $121,193 |
| 2015 | $1,840 | $165,597 | $46,224 | $119,373 |
| 2014 | $1,770 | $162,354 | $45,319 | $117,035 |
Source: Public Records
Map
Nearby Homes
- 255 Flame Tree Place
- 4786 Macadamia Ct
- 4791 Macadamia Ct
- 185 Harrison St
- 4798 Calle Los Santos
- 154 Harrison St
- 4750 Calle Estrella
- 761 Masters Dr
- 4781 Calle Las Positas
- 4918 Roja Dr
- 4468 White Pine Way
- 5063 Waterview Way
- 838 Masters Dr
- 5065 Waterview Way
- 5010 Golondrina Way Unit 64
- 328 Liberty Way
- 5108 Andrew Jackson St
- 4924 Verde Dr
- 4950 Luna Dr
- 0 N River Rd Unit NDP2507519
- 4745 Sequoia Place
- 4753 Sequoia Place
- 4757 Sequoia Place
- 4761 Sequoia Place
- 4765 Sequoia Place
- 241 Conifer Dr
- 4748 Sequoia Place
- 4752 Sequoia Place
- 4744 Sequoia Place Unit 5
- 4756 Sequoia Place
- 4740 Sequoia Place
- 4760 Sequoia Place
- 4769 Sequoia Place
- 237 Conifer Dr
- 237 Sorrel Tree Place
- 4764 Sequoia Place
- 234 Flame Tree Place
- 4736 Sequoia Place
- 241 Sorrel Tree Place
- 233 Conifer Dr
Your Personal Tour Guide
Ask me questions while you tour the home.